
Figures & data
Table 1. Baseline characteristics of the derivation set and validation set.
Table 2. Model coefficients and odds ratios.
Figure 1. External validation of the clinical screening tool for non-adherence. (A) Plot of external calibration of clinical screening tool in Heartlands Hospital population showing the agreement between predicted and observed probabilities of non-adherence after recalibration. (B) Receiver operating characteristics (ROC) curve showing the discriminative performance of the diagnostic tool.
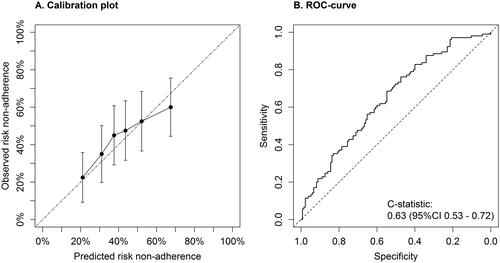
Table 3. Test characteristics and proportion of patients spared chemical adherence testing.
Supplemental material
Supplemental Material
Download ()Data availability statement
The data that support the findings of this study are available from the corresponding author, WS, upon reasonable request.