
Figures & data
Table 1. Baseline and follow-up clinical and BP data according to TTR and systolic BP coefficient of variation groups.
Table 2. Cox regression models for major cardiovascular events setting as predictor variables time to therapeutic range or blood pressure coefficient of variation before and after adjustment for confounders.
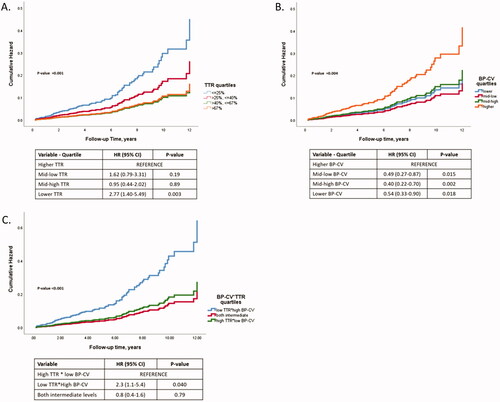
Figure 1. Prediction of the composite outcomes in Cox regression models of BP control measures stratified quartiles after adjustment for confounders. (A), quartiles of TTR; (B), quartiles of BP-CV; (C), combined quartiles of both measures.
Supplemental material