Figures & data
Table 1. Baseline characteristics.
Figure 1. Development of the machine learning model. The overall flow of the development of the supervised ML models for predicting post-treatment ambulatory BP levels is shown.
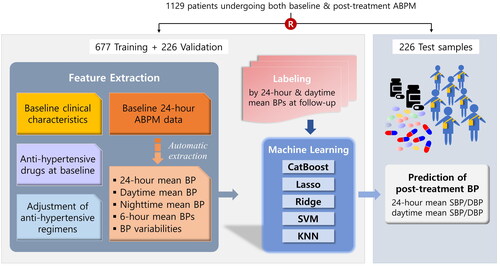
Table 2. Features used for machine learning.
Table 3. Twenty-four-hour ABPM data at baseline and at follow-up.
Figure 2. Model performance for the prediction of averaged 24-hour SBP and DBP. Left panel: For the prediction of averaged 24-hour SBP at follow-up, the mean absolute errors (MAEs) and the mean squared errors (MSEs) were 8.3 mmHg and 10.9 mmHg, respectively, with CatBoost, 8.9 mmHg and 11.8 mmHg with K-nearest neighbour (KNN), and 8.9 mmHg and 11.3 mmHg with support vector machine (SVM). Right panel: To predict averaged 24-hour DBP at follow-up, the MAEs and the MSEs were 5.3 mmHg and 6.8 mmHg, respectively, with CatBoost, 6.0 mmHg and 7.8 mmHg with KNN, and 6.1 mmHg and 7.8 mmHg with SVM.
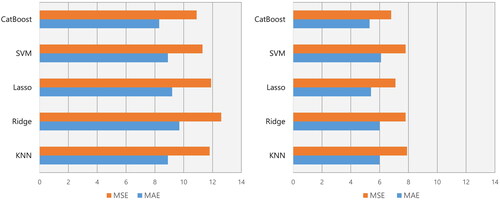
Table 4. Prediction of post-treatment 24-hour ambulatory BP in test set.
Table 5. Prediction of post-treatment daytime ambulatory BP in test set.
Figure 3. Comparison between CatBoost-predicted vs. ABPM-measured ambulatory BP changes. In the test set, there are significant correlations between CatBoost-predicted changes compared to the ABPM-measured changes in mean 24-hour BPs from baseline to follow-up (upper panels). Furthermore, the CatBoost-predicted changes in mean daytime BPs correlate with the ABPM-measured BP changes (lower panels).
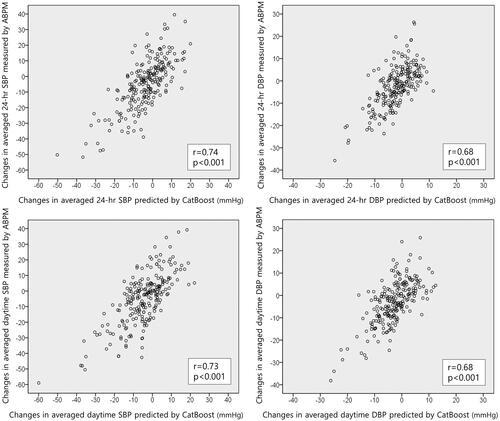
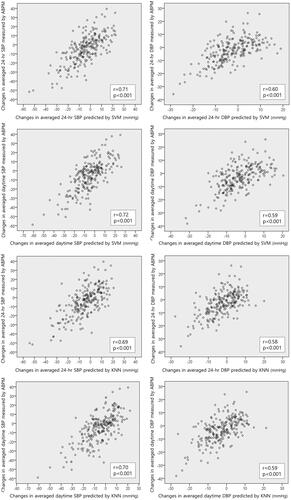
Figure 4. Prediction of ambulatory BP changes by KNN and SVM. In the test set, there are significant correlations between the model-predicted changes compared to the ABPM-measured changes from baseline to follow-up.