Figures & data
Figure 1. Flow chart of the study. ATRH: apparently treatment-resistant hypertension; eGFR: estimated glomerular filtration rate (Chronic Kidney Disease Epidemiology Collaboration formula 2021); NAH: non-resistant arterial hypertension.
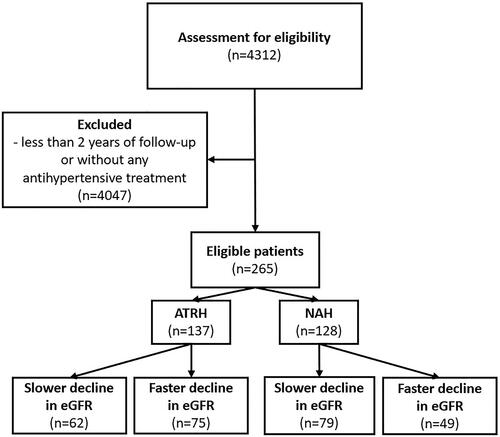
Table 1. Baseline clinical characteristics, renal function and average blood pressure values throughout follow-up in patients in the ATRH and NAH groups.
Table 2. Medication of patients in the ATRH and NAH groups.
Figure 2. Development of serum creatinine during follow-up.
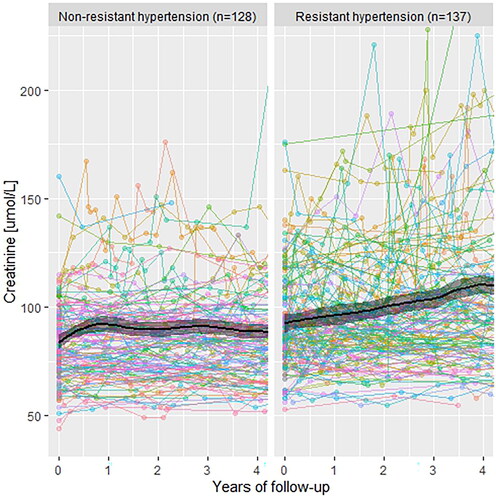
Figure 3. Development of estimated glomerular filtration rate (eGFR and CKD-EPI) during follow-up. CKD-EPI: Chronic Kidney Disease Epidemiology Collaboration formula 2021.
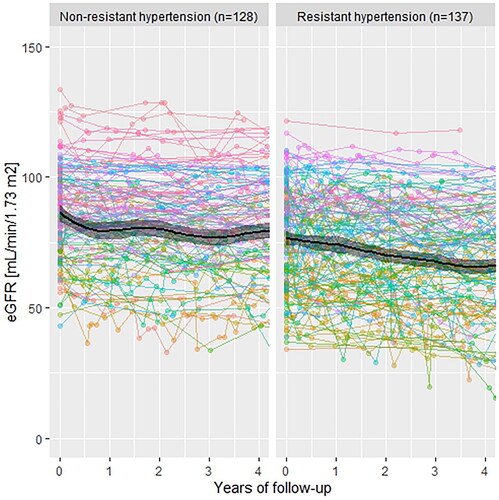
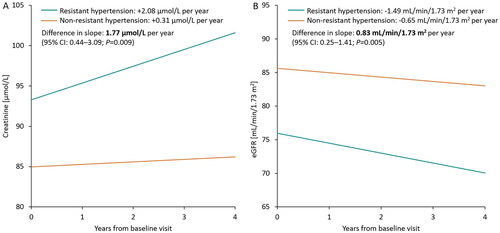
Figure 4. Trajectory of serum creatinine levels (A) and estimated glomerular filtration rate (B) after age and diabetes adjustment during follow-up: linear mixed-effect model analysis. eGFR: estimated glomerular filtration rate (Chronic Kidney Disease Epidemiology Collaboration formula 2021).