
Figures & data
Table 1. Mean total AUDIT score (standard deviations; number of respondents, N) at each measurement year by gender and age group.
Figure 1. Mean total AUDIT scores for men (A) and women (B) over the years 1997 through 2018 separated by each age category, diamond (♦) 17–27 year olds, box (▪) 28–38 year olds, triangle (Δ) 39–49 year olds, cross (×) 50–60 year olds, plus (+) 61–71 year olds, and circle (•) 72–80 year olds.
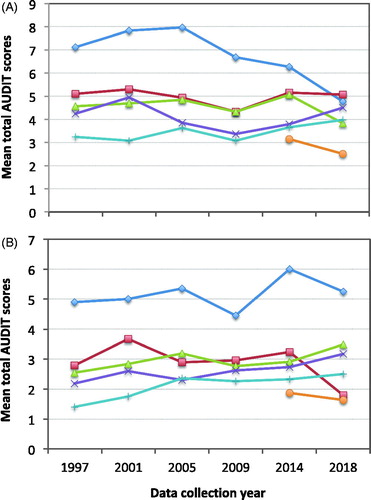
Table 2. Results of three-way ANOVA showing main and interaction effects for assessment year, gender and age group, with F-statistics, degrees of freedom (Df) and p-values.