
Figures & data
Figure 1. Flow chart of the study design.
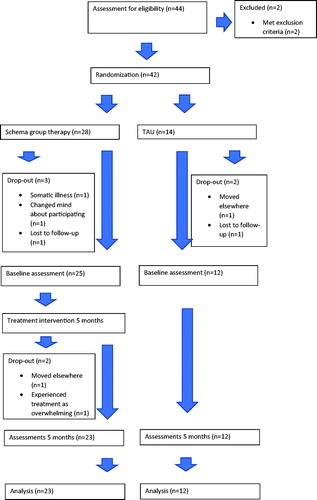
Table 1. Program of the schema group therapy.
Table 2. Sociodemographic and clinical characteristics of intervention and control group patients.
Figure 2. Average BSL score (left panel) and BSL behavior score (right panel) in the TAU and Schema therapy groups at both baseline and follow-up. The whiskers denote 95% Wald’s confidence intervals.
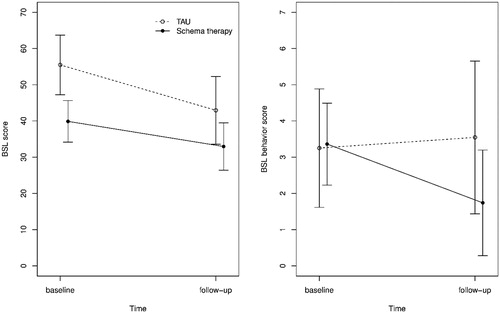
Table 3. Treatment effects with multiple imputation of missing data.