
Figures & data
Figure 1. Paired samples t-tests of deviating mean death frequency on Midsummer’s Eve (ME), Midsummer’s Day (MD) and the mean of both days (MEMD), compared to the mean death frequency on Adjacent Dates (AD). Bars show the mean death frequency, and the 95% confidence intervals represent the annual variability. The dotted horizontal line represents the mean frequency across all days (4.32 deaths per day = 3.31 deaths due to suicide + 1.02 deaths with undetermined intent).
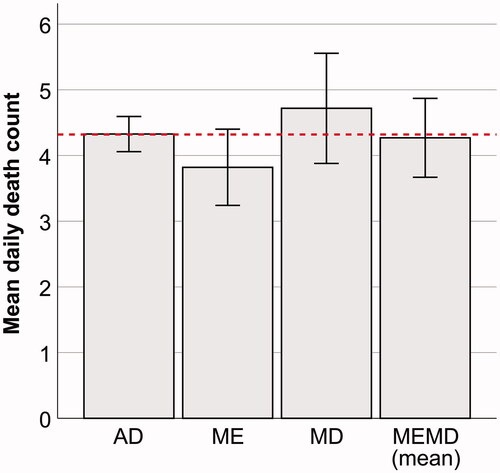
Figure 2. Mean death frequency (diagnosis type = suicide) for each day in the observation period. Midsummer’s Eve (ME) always occurs on a Friday (June 19th to 25th) and is followed Midsummer’s Day (MD) on the next day (center of X-axis). The 95% confidence intervals reflect the variance in suicide between the 39 years. Mean daily frequency across all days = 3.31 deaths (dotted horizontal line).
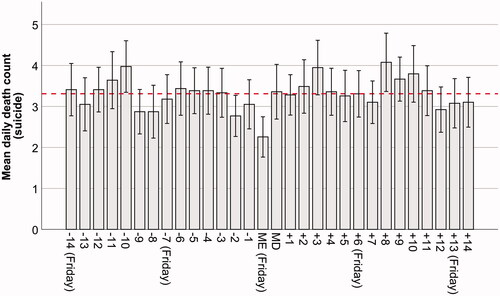
Figure 3. Mean death frequency (diagnosis type = undetermined intent) for each day in the observation period. Midsummer’s Eve (ME) always occurs on a Friday (June 19th to 25th) and is followed Midsummer’s Day (MD) on the next day (center of X-axis). The 95% confidence intervals reflect the variance in suicide between the 39 years. Mean daily frequency across all days = 1.02 deaths (dotted horizontal line).
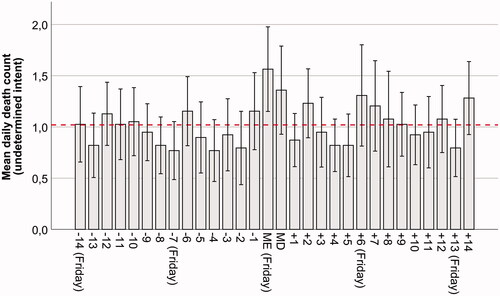
Table 1. Descriptive statistics.
Supplementary_file.docx
Download MS Word (640.6 KB)Data availability statement
The data used for this study was provided by the Swedish National Board of Health and Welfare, in 2019. For ethical reasons, we do not provide raw data from the Swedish cause of death registry (see ethical statement in section: Methods and materials). Other methodological information to support replication by independent researchers is available from the corresponding author upon request.