Figures & data
Table 1. Participant characteristics.
Table 2. Items and dimensions of the SCL-90-R and SCL-9S.
Table 3. Summary statistics for the five SCL-9S rating scale categories for inpatients (IP) and outpatients (OP).
Table 4. Fit statistics.
Table 5. Item mean raw score (M) and standard deviations (SD) for men and women in the inpatient (IP) and outpatient (OP) groups.a
Figure 2. Person item maps for men and women. Note. M: mean of person or item distribution; S: one standard deviation from the person or item mean; T: two standard deviations from the person or item mean.
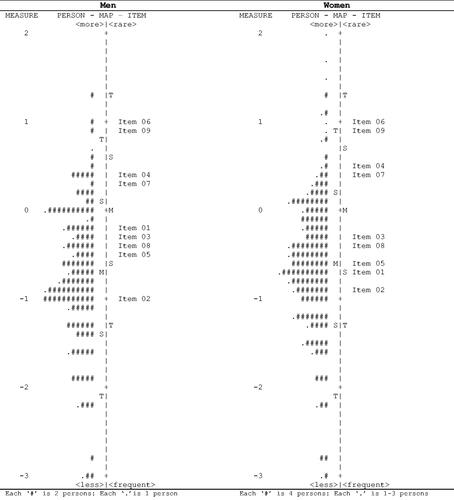
Figure 3. Cluster analysis of SCL-9S data of psychiatric in- and outpatients.
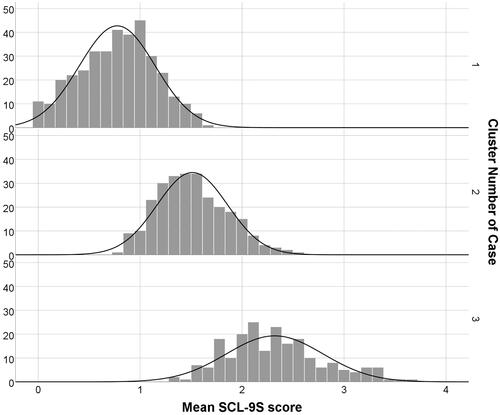
Table 6. Mean scores per item of the SCL9S across patient clusters.
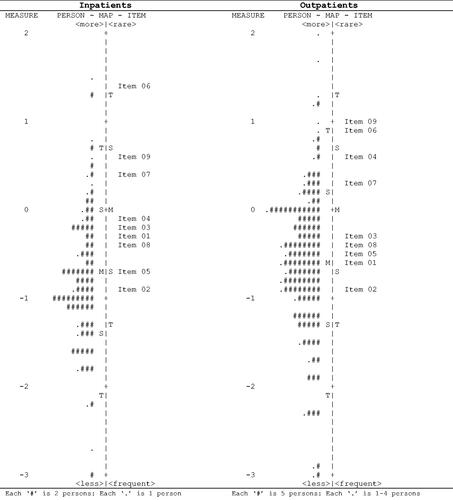
Figure 1. Person item maps for the psychiatric inpatient and outpatient groups. Note. M: mean of person or item distribution; S: one standard deviation from the person or item mean; T: two standard deviations from the person or item mean.