Figures & data
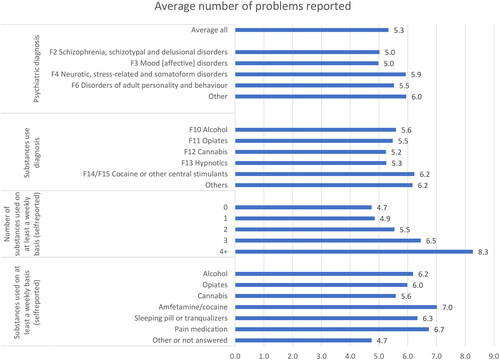
Figure 1. Comparison DUDIT-E and DrugCheck items on domains affected and type of problems.
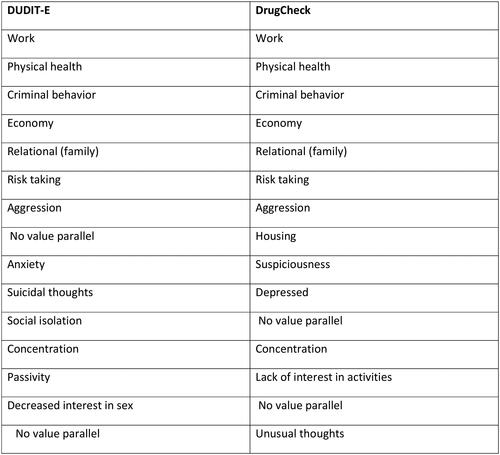
Table 1. Demographics and descriptive features of the population by DUDIT-E or DrugCheck questionnaire respectively.
Table 2. Ranking of problems listed on the DrugCheck questionnaire according to percentage answering ‘some’ or ‘a lot’.
Table 3. Ranking of experienced negative consequences reported on the DUDIT-E questionnaire (two different scales) according to most often experienced to the least often experienced.
Table 4. Ranking of positive effects of using preferred substance reported on the DUDIT-E questionnaire.
Figure 2. Average number of problems listed on the Drugcheck questionnaire according to primary diagnosis and substances used weekly. *T-test against the remainder. **Test of trend.