
Figures & data
Figure 1. Chart with participant flow during and after the randomized clinical trial (RCT). †1 died by suicide, 3 felt too unstable and 2 were unavailable to schedule time‡From the former BA group in the RCT. §From the former control group in the RCT.
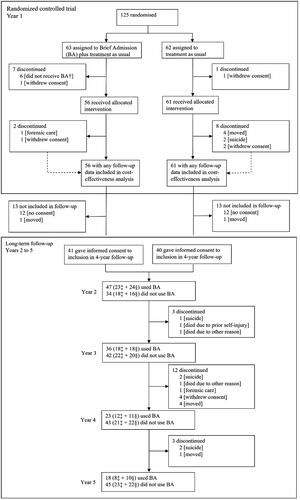
Table 1. Unit prices and cost calculation of hospital care in euros, 2020.
Table 2. Estimated treatment cost before and during randomized controlled trial (in euros based on 2020 prices; n = 117).
Table 3. Quality-adjusted life years (QALYs) during 1-year randomized controlled trial (RCT).
Table 4. Cost-effectiveness of Brief admission by self-referral as add on to usual care compared to usual care alone (2020 prices in euros).
Figure 2. Scatterplots of bootstrap re-sampling based on actual bed occupancy in 2020 (blue) and capacity-adjusted to an average of 85% bed occupancy (orange) for complete cases (n = 37, boxes a and C) and all cases, using multiple imputation on utility where missing (n = 117, boxes B and D). The horizontal axes show QALY gain with BA versus TAU. The vertical axes show incremental cost in euros (mean cost with BA versus TAU).
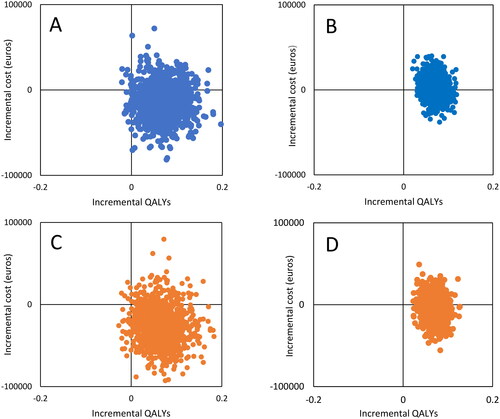
Figure 3. Number of days admitted to hospital (boxes a and B) and treatment costs in euros (boxes C and D), average per person per year before, during, and after the randomized controlled trial (RCT). BA: intervention group during RCT (n = 56); Control: control group during RCT (n = 61). Base case: prices based on actual bed occupancy rate; Capacity-adjusted scenario: prices based on an average bed occupancy rate of 85%. See supplement 7 for costs during follow-up, including costs discounted with 3% to account for differential timing in accordance with recommendations [Citation25].
![Figure 3. Number of days admitted to hospital (boxes a and B) and treatment costs in euros (boxes C and D), average per person per year before, during, and after the randomized controlled trial (RCT). BA: intervention group during RCT (n = 56); Control: control group during RCT (n = 61). Base case: prices based on actual bed occupancy rate; Capacity-adjusted scenario: prices based on an average bed occupancy rate of 85%. See supplement 7 for costs during follow-up, including costs discounted with 3% to account for differential timing in accordance with recommendations [Citation25].](/cms/asset/40e9cd7f-1f2d-4780-8b07-f105860e0207/ipsc_a_2366854_f0003_c.jpg)
Supplemental Material
Download MS Word (97.5 KB)Data availability statement
The clinical data supporting the study findings are not publicly available. In the approval from the regional ethical review board (2014/570), it is stated that data should only be presented on a group level as these might contain sensitive information.