Figures & data
Figure 1. Overview of central eastern Australia showing the major crustal boundaries from Korsch and Doublier (Citation2016) on a semitransparent grey-scale 1VD RTP magnetic intensity image, draped on a Bouguer gravity image (cool colours indicate lower density); position of and Supplementary papers, Figures S1, S2 are shown. Also shown is the position of deep seismic reflection lines 05GA-TL1, 05GA-TL2, 05GA-TL3, 99AGS-C1 and BMR84-14.
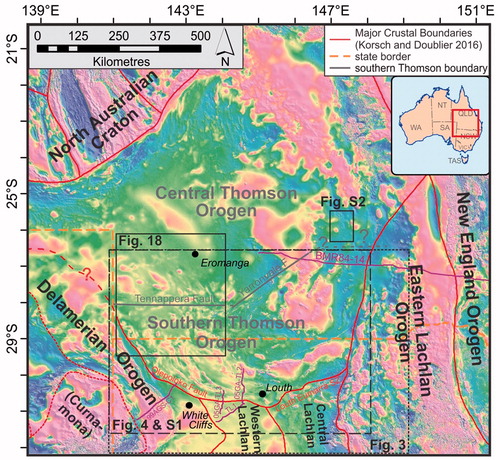
Figure 2. Time–space plot for the southern Thomson Orogen divided into domains and regions, showing the major units. The plot is simplified after Purdy et al. (Citation2018), to whom we also refer for a compilation of geochronological constraints. The stratigraphy is dominated by a Cambrian to Ordovician metasedimentary package and an upper Silurian to Lower Devonian package of metasedimentary and volcanic rocks. Also displayed is the timing of the major orogenies of the Tasmanides (see text for details).
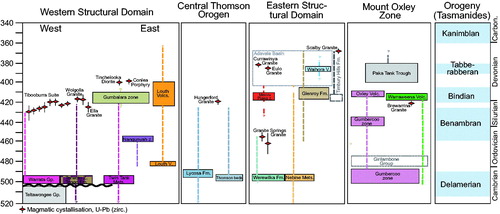
Figure 3. 3D crustal architecture of the southern Thomson and northern Lachlan orogens looking north (from Doublier, Brennan, Korsch & Nicoll, Citation2016), illustrating the geometries of the major crustal boundaries of the area. Also shown are deep seismic reflection lines 05GA-TL1, 05GA-TL2, 05GA-TL3, 99AGS-C1 and BMR84-14. Green, Moyston Fault northern extension; yellow, Paddington Line; blue, Gilmore Fault and unnamed northern extension; orange, Olepoloko Fault; white, Bancannia Shear Zone and extension. The grey surface and corresponding colour bar represent the Moho depth (km).
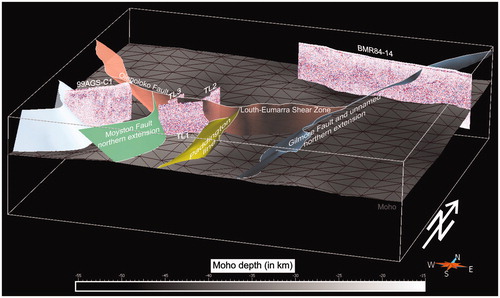
Figure 4. Interpretation of the major faults and shear zones shown on: (a) a semitransparent grey-scale 1VD RTP magnetic intensity image draped on a Bouguer gravity image (cool colours indicate lower density); and (b) a simplified basement geology map of the southern Thomson Orogen (after Purdy et al., Citation2018) with the positions of deep crustal and basin seismic reflection lines illustrated in the paper. BF: Bundarra Fault; CaFZ: Caiwarro Fault Zone; CuFZ: Currawinya Fault Zone; DF: Dungarvon Fault; GF: Gumbalie Fault; GuF: Gundabooka Fault; LMF: Little Mountain Fault; MDF: Mount Druid Fault; MOF: Mount Oxley Fault; MYF: Mount Young Fault; MTF: Mulga Tank Fault; MF: Myrt Fault; PF: Purnanga Fault; RF: Rookery Fault; RHF: Rose Hill Fault; TF: Tongo Fault; TWFZ: Tooley Wooley Fault Zone; VF: Valetta Fault; WRF: Willies Range Fault; WF: Wuttagoona Fault.
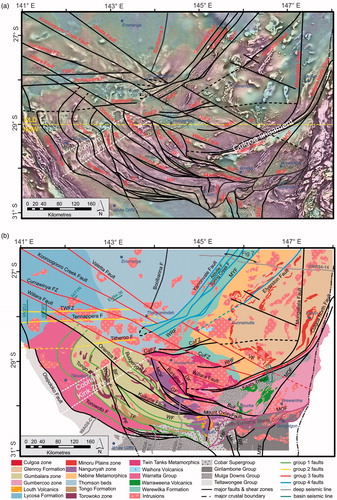
Figure 5. Examples of basin seismic lines (see for locations) used to constrain the position and (apparent) dip direction of major faults (a) line 95GDJ (vertical exaggeration ∼2); (b) squeezed part of line 95GDJ imaging the Tennapera Fault and Tooley Wooley Fault Zone (vertical exaggeration ∼10); (c) line EH84-36 intersecting the Kooroogooro Creek Fault (vertical exaggeration ∼2); (d) line 95FWT showing reactivation of the Orientos and Willara faults. Note that the Tooley Wooley Fault Zone intersected at CDP ∼1500 is not reactivated in this line; and (e) line 84TYN showing the Currawinya Fault Zone with a minor back thrust. Basin seismic lines have been accessed via the Geological Survey of Queensland.
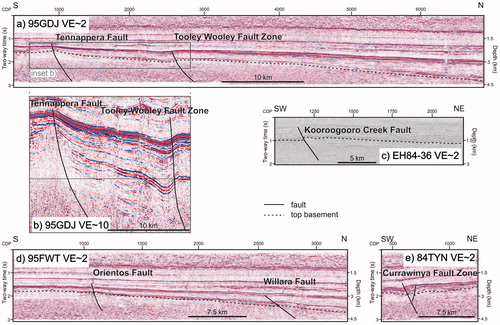
Table 1. Major faults of the southern Thomson Orogen.
Figure 6. Reinterpretation of deep seismic reflection lines (a) 05GA-TL2, (b) 05GA-TL3, and (c) detailed view of the Lachlan–Thomson boundary in line 05GA-TL3. Interpretation of the middle and upper crust in the Lachlan Orogen is after Glen et al. (Citation2013). See and for the position of seismic lines.
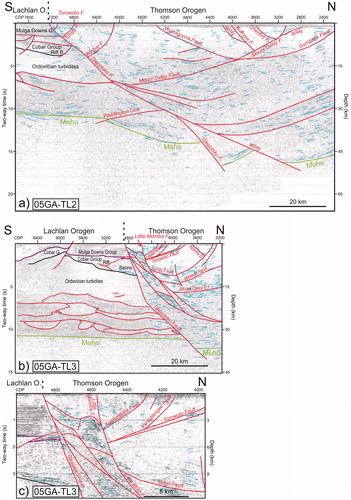
Figure 7. Westernmost part of deep seismic reflection line BMR84-14 (see for location) showing the upper crustal configuration of the Group 4 major faults defining the Boondoona Creek Corridor.
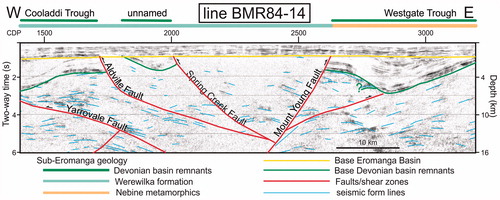
Figure 8. Structural interpretation of the ESD on grey-scale 1VD RTP magnetic intensity image (white corresponds to high magnetic intensity); see for position; RHF: Rose Hill Fault.
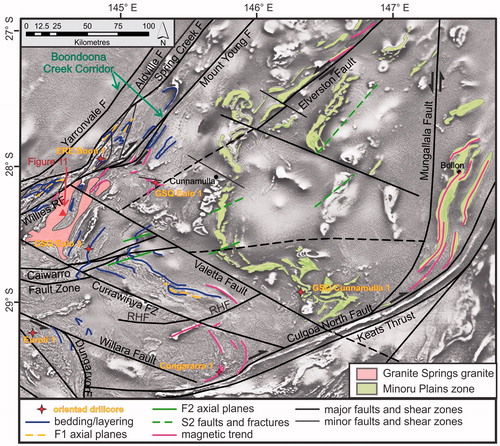
Figure 9. Composite image of basement geology of the southern Thomson Orogen and RTP TMI magnetic data showing the structural domains of the southern Thomson Orogen and their proposed boundaries (thick lines); same legend as . Also shown is the position of . BuF: Burkano Fault; CaFZ: Caiwarro Fault Zone; CuFZ: Currawinya Fault Zone; MOF: Mount Oxley Fault; RHF: Rose Hill Fault; TWFZ: Tooley Wooley Fault Zone.
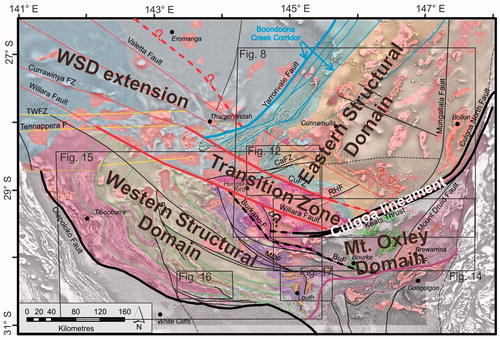
Figure 10. Interpretation and potential field modelling of seismic line DMR98-02 transecting the Culgoa Shear Zone and the Paka Tank Trough (after Hegarty & Doublier, Citation2015). Numbers in the lower panel correspond to density (upper, in gm/cm3) and magnetic susceptibility (lower, in SI) values used for the modelling. See and for position of seismic line DMR98-02.
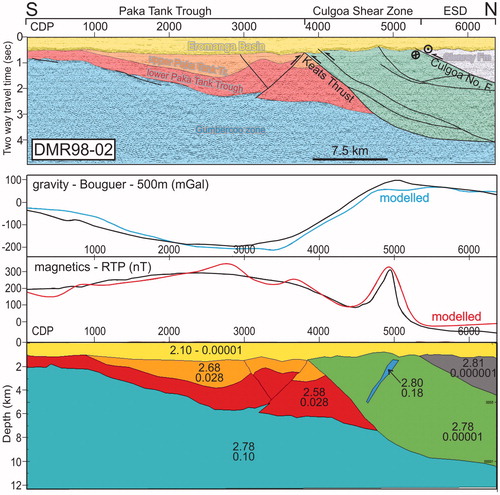
Figure 11. (a) Photo of a high strain zone in the Granite Springs Granite outcrop; and (b) feldspar phenocrysts showing sinistral shearing. See for location.
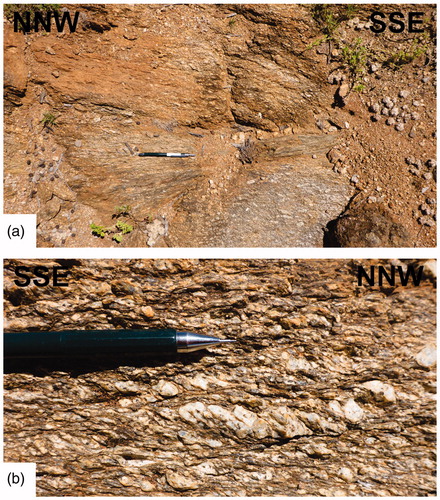
Figure 12. Structural interpretation of the hinge area of the Wyuna Megafold on a grey-scale 1VD RTP magnetic intensity image (white corresponds to high magnetic intensity); see for location, and for legend.
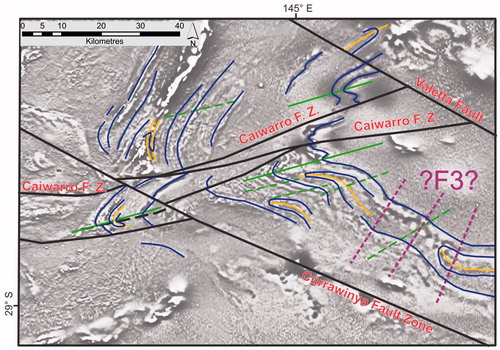
Figure 13. Schmidt net plots from oriented drill core, with locations given in and . (a) ERE Boon 1 bedding and main foliation (S1), (b) ERE Boon F1 fold axes, (c) GSQ Eulo 1 foliation, (d) GSQ Eulo 1 F1 fold axes, (e) GSQ Eulo 3 foliation (S1) and bedding, (f) GSQ Cunnamulla 1 foliation (?S1), (g) Congararra 1 (shear) foliation, (h) Laurelvale 1 bedding subparallel foliation (S1), and F1 fold axes, and (i) Euroli 1 bedding and foliation (?S1); all measurements were taken using a rocket launcher core orientation device (all plots lower hemisphere).
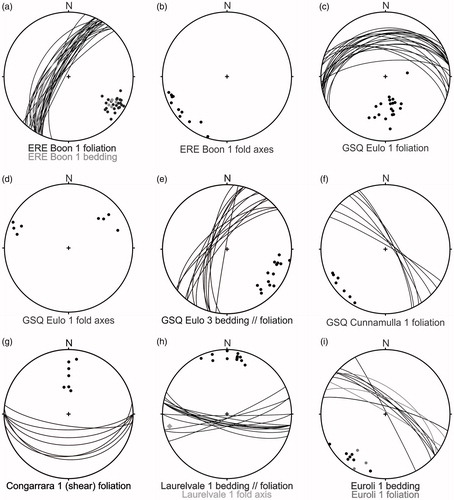
Figure 14. Structural interpretation of the Mount Oxley Domain on a grey-scale 1VD RTP magnetic intensity image (white corresponds to high magnetic intensity); see for position. MOF: Mount Oxley Fault. Also shown is the position of seismic line DMR98-02.
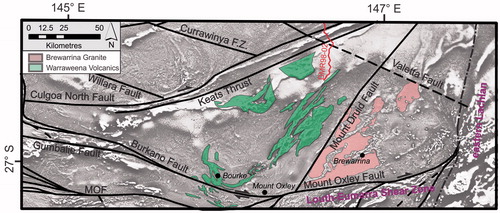
Figure 15. Structural interpretation of the WSD on a grey-scale 1VD RTP magnetic intensity image (white corresponds to high magnetic intensity); see for position. Also shown is the position of . BF: Bundarra Fault; MOF: Mount Oxley Fault; PF: Purnanga Fault.
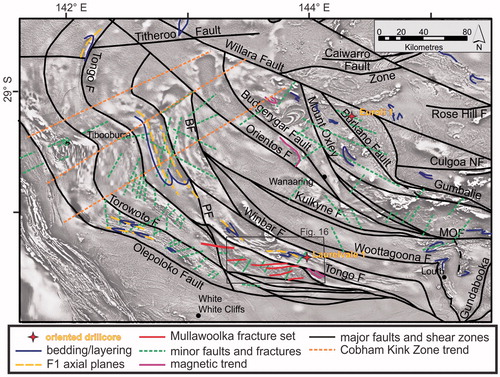
Figure 16. Structural interpretation of the southwest part of the WSD on a grey-scale 1VD RTP magnetic intensity image (white corresponds to high magnetic intensity); see and for position.
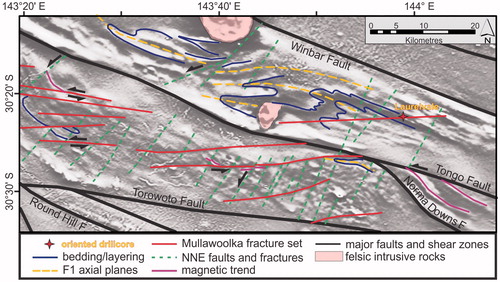
Figure 17. Structural interpretation of the Louth area (WSD) on a grey-scale 1VD RTP magnetic intensity image (white corresponds to high magnetic intensity); see for position.
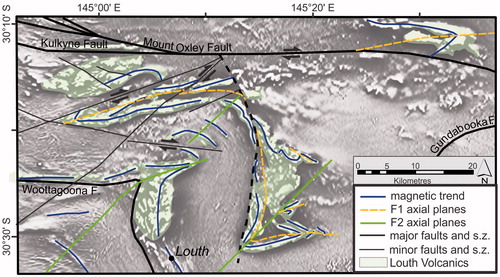
Figure 18. Structural interpretation of the northern part of the WSD, and its continuation to the north into the central Thomson Orogen. (a) Major faults and shear zones with interpreted magnetic trendlines on a semitransparent tilt derivative magnetic image (in colour), draped over a grey-scale 1VD RTP magnetic intensity image. Also shown are granitic intrusions (in pink) overprinting and masking the regional magnetic pattern related to Warrata Group sediments and equivalents in the corridor defined by Group 2 faults (yellow). (b) Interpretation Model A (after Abdullah & Rosenbaum, Citation2017) of the linework presented in (a), emphasising dextral shearing and dragging along the Currawinya Fault Zone, which forms part of the Group 3 faults (in red). (c) Interpretation Model B of the linework presented in (a), relating the observed pattern to dextral shearing along the Tooley Wolley Fault Zone and the Tennappera Fault (solid yellow lines). (d) Interpretation Model C of the linework presented in (a), suggesting a pre-existing southeast-ward closing fold, which is intersected by Group 2 (in yellow) and Group 3 (in red) faults without shear-related dragging of magnetic units. BF: Bundarra Fault; CaFZ: Caiwarro Fault Zone; MOF: Mount Oxley Fault; see for position.
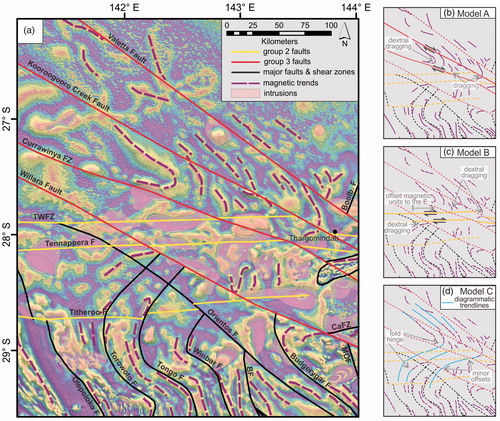
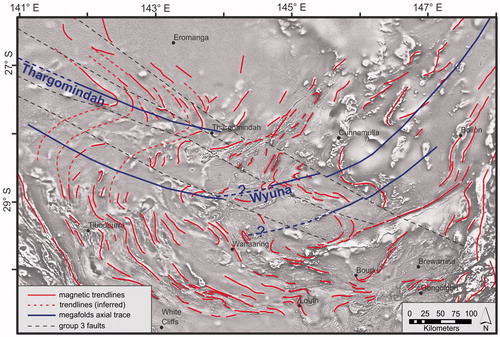
Figure 19. Structural interpretation of the southern Thomson Orogen showing magnetic trendlines of stratigraphic units. The figure illustrates the existence of large-scale megafolds in the southern Thomson, most prominent the Wyuna Megafold and the Thargomindah Megafold. Also shown are interpreted axial planes of these structures.