
Figures & data
Figure 1. Location of the CO2CRC Otway Facility at South Nirranda, Victoria.
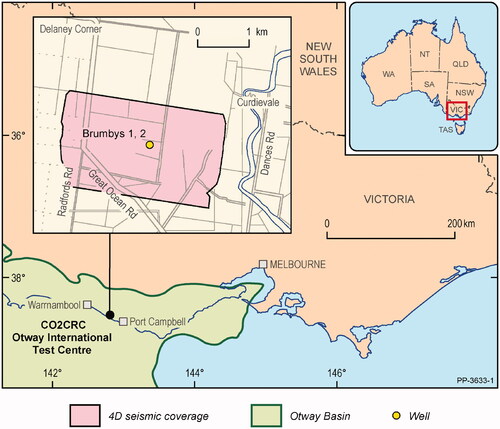
Figure 2. Stratigraphic context of the Port Campbell Limestone in the Otway Basin.
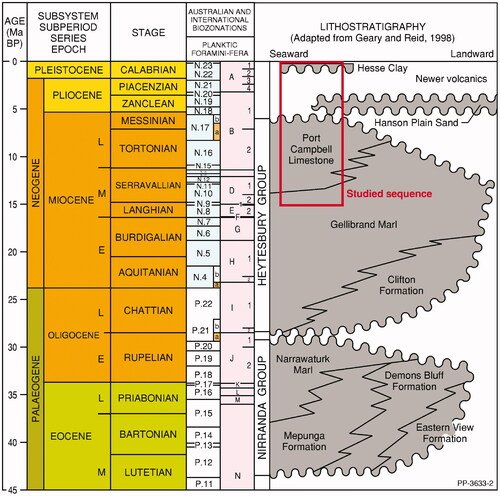
Figure 3. (a) Isopach map of the Port Campbell Limestone in the Port Campbell Embayment (Bush, Citation2009). (b) Character of the Port Campbell Limestone is defined by SP (LHS) and Resistivity (RHS) logs in all wells except Brumbys 1 (Vcl gamma only). Shoaling-upward cyclicity (Resistivity) appears to be characteristic. Resistivity cycles suggest both decreasing salinity of porewaters and/or increased porosity in cleaner carbonates upcycle. The thick black line indicates the boundary between the Port Campbell Limestone (PCL) and Gellibrand Marl (GBM) based on resistivity/gamma signal and well logs. In Brumbys 1, the boundary between the Hesse Clay and Port Campbell Limestone is also shown.
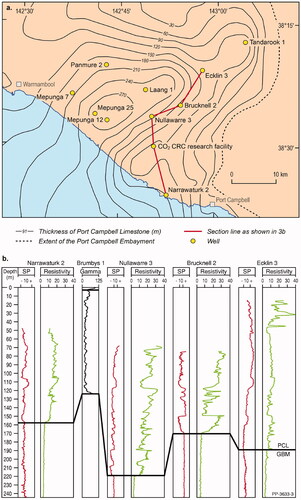
Figure 4. View northwards of CO2CRC Otway site adjoining a prominent dune system. The Otway site has a terrain of subtle swale features aligned northeast. South of the dune system features of similar alignment have exaggerated relief suggestive of karst enhancement on the Port Campbell Limestone, probably due to erosional loss of the capping Hesse Clay. LIDAR image. Note that regional seismic suggests that Brumbys Fault is ∼1.2 km long and only the portion imaged using high-resolution seismic (top of Port Campbell Limestone) is shown here.
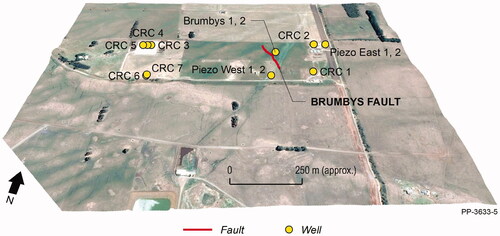
Figure 5. Schematic of Brumbys Fault and drilling intercepts from Brumbys 1 and Brumbys 2, with 2 m displacement of glauconitic mud marker at 28 m depth and ∼4 m displacement at top of Gellibrand Marl (3 D seismic interpretation). Horizontal distances not to scale.
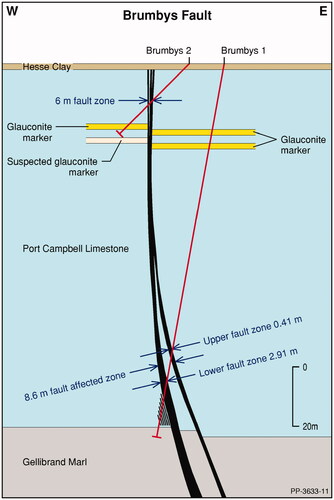
Table 1. List of Miocene planktic foraminiferal datums used for biostratigraphic analyses in southeast Australia.
Figure 6. Port Campbell Limestone lithofacies: column 1, core log depth; column 2, second-order SPCLunits; column 3, gamma log (GRI) and graphic of inferred lithology (mud(brown)-sand (yellow)); column 4, high-resolution (GR) and smoothed gamma (GRS) logs with SP log; column 5, visually interpreted third-order depositional events. The second-order cycles were determined from integration of gamma logs, effective porosity and permeability logs with correlation to seismic data. Core log depths and SPCLunits (column 2) are used for all discussion in this paper.
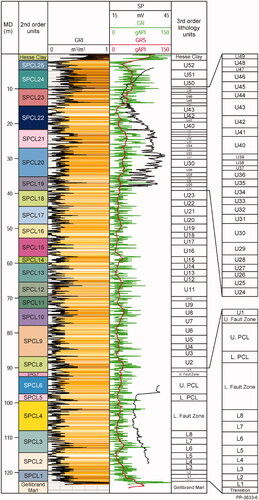
Figure 7. Limestone clasts of variably rotated orientation within a dense muddy matrix exhibiting flow laminae. Lower fault zone, NPCL 4, Brumbys 1. Horizontal field of view is 23 mm; blue denotes porosity.
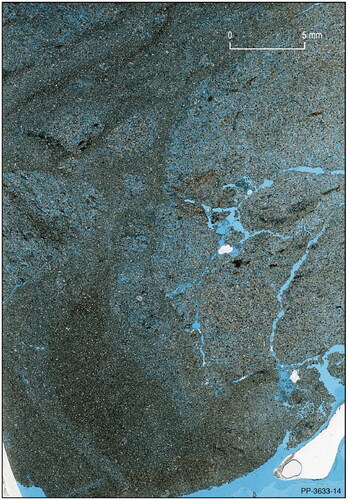
Figure 8. Brumbys Fault and intercepting boreholes Brumbys 1 and 2 within part of the CO2CRC Otway site. Variable depth and degree of weathering in the upper Port Campbell Limestone is influenced by regional jointing as indicated by refraction seismic tomography using seismic P velocities. Alignment of lower velocity zones (<1900 m/s) caused by higher porosity carbonates along apparent joint sets. The trace of the Brumbys Fault at the top of the Port Campbell Limestone shows strike slip character, both paralleling jointing and with jogs up to 30°. Note that regional seismic suggests that Brumbys Fault is ∼1.2 km long and only the portion imaged using high-resolution seismic (top of Port Campbell Limestone) is shown here.
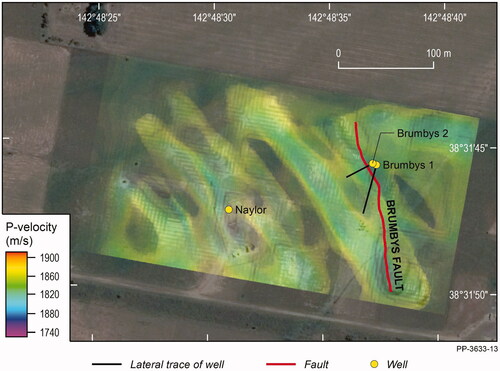
Figure 9. (a, b) Whole-rock mineralogy determined through XRD analysis. Only the mud fraction is presented. Grainsize was determined though dry sieving into Wentworth scale fractions (wt%), with mud/silt/clay (<63 µm), sand (63–2000 µm) and gravel (2–>16 mm) proportions for each sample. Laser diffraction analysis was used for very fine-grained samples and the results are included in the ‘mud’ size fraction (converted to wt%).
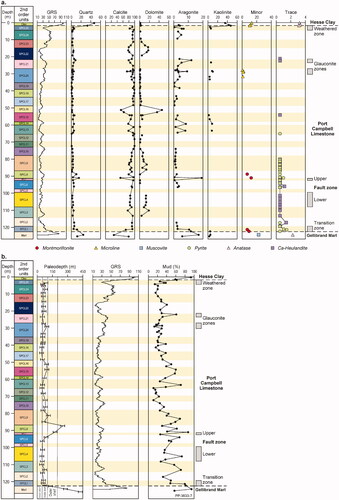
Figure 10. Key features of the Hesse Clay, Port Campbell Limestone and top of Gellibrand Marl in Brumbys 1. Core tray lengths are 1 m.
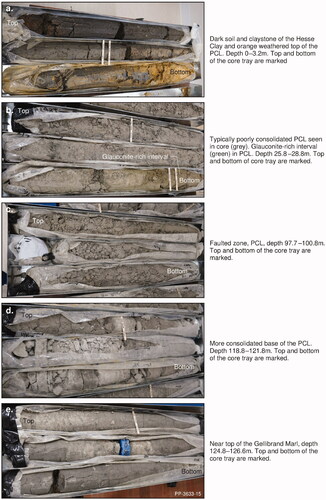
Figure 11. (a, b) Geochemical signatures and ratios from XRF and ICP-MS analysis (note, CaCO3 analysis was completed separately). (c) Plots of Ce, Eu/Eu*, (La/Nb)N, Sr, Th and Zr/TiO2 vs depth (m). Green circles = Hesse Clay; blue squares and yellow circles = Port Campbell Limestone (high- and low-U, respectively see ); and orange diamonds = Gellibrand Marl. Values for Ce and Th for Hesse Clay are significantly higher (Ce 169–217 ppm, Th 24.6–30 ppm), than in the other units (and plot off the figures). Note the broad increase up hole (decreasing depth) in Ce, Th and ratios Eu/Eu*, (La/Nb)N, and corresponding decrease in Sr. The Zr/TiO2 ratio also shows a broad increase up hole with a pronounced increase in range above 30 m, suggesting input of a more siliceous source. Also of note are the samples from the lower part of the Port Campbell Limestone (below 115 m), which show a transition for many elements with the underlying Gellibrand Marl (most evident in Ce and Eu/Eu*). Eu/Eu* = (2*Eu/0.058)/(Sm/0.153 + Gd/0.2055), is a measure of the degree of enrichment (>1) or depletion (<1) in Eu relative to the other rare earth elements. (La/Nb)N [La/Nb ratio normalised to primitive mantle] = (La/0.687)/(Nb/0.713), and is a measure of the relative depletion of Nb relative to La.
![Figure 11. (a, b) Geochemical signatures and ratios from XRF and ICP-MS analysis (note, CaCO3 analysis was completed separately). (c) Plots of Ce, Eu/Eu*, (La/Nb)N, Sr, Th and Zr/TiO2 vs depth (m). Green circles = Hesse Clay; blue squares and yellow circles = Port Campbell Limestone (high- and low-U, respectively see Figure 20); and orange diamonds = Gellibrand Marl. Values for Ce and Th for Hesse Clay are significantly higher (Ce 169–217 ppm, Th 24.6–30 ppm), than in the other units (and plot off the figures). Note the broad increase up hole (decreasing depth) in Ce, Th and ratios Eu/Eu*, (La/Nb)N, and corresponding decrease in Sr. The Zr/TiO2 ratio also shows a broad increase up hole with a pronounced increase in range above 30 m, suggesting input of a more siliceous source. Also of note are the samples from the lower part of the Port Campbell Limestone (below 115 m), which show a transition for many elements with the underlying Gellibrand Marl (most evident in Ce and Eu/Eu*). Eu/Eu* = (2*Eu/0.058)/(Sm/0.153 + Gd/0.2055), is a measure of the degree of enrichment (>1) or depletion (<1) in Eu relative to the other rare earth elements. (La/Nb)N [La/Nb ratio normalised to primitive mantle] = (La/0.687)/(Nb/0.713), and is a measure of the relative depletion of Nb relative to La.](/cms/asset/3fa198ac-705d-4b93-be28-509975223863/taje_a_1998220_f0011_c.jpg)
Figure 12. Cliff face on Sturgess Point at Port Campbell, demonstrating preferential weathering by lithology. Shoaling-upward cycles are evident, from a basal marly limestone to marl upward to limestone. Cliff height from sea-level to base Hesse Clay is 22 m (After DSE, Citation2011).
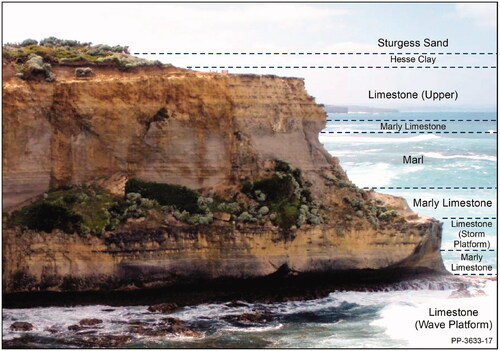
Figure 13. Self-Potential (SP) and Resistivity logs of Nullawarre 3 bore with cored intervals. Resistivity short (green trace) and long normal (black trace) (Department of Mines, Victoria, Citation1965) showing a distinctive large period cyclicity within the Port Campbell Limestone.
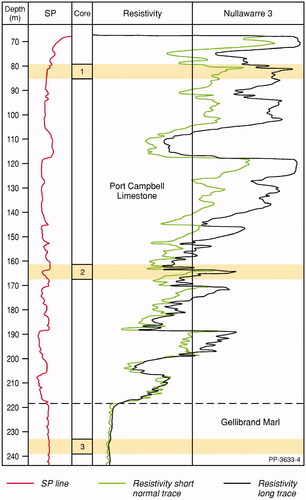
Figure 14. Averaged porosity and permeability for SPCLunits of the sequence: column 1, core depth; column 2, lithostratigraphic SPCLunits; column 3, gamma log (GRI) and graphic of inferred lithology (mud (brown)-sand (yellow)); column 4, high-resolution gamma (GR) and smoothed gamma (GRS) log; column 5, porosity; column 6, permeability (mD).
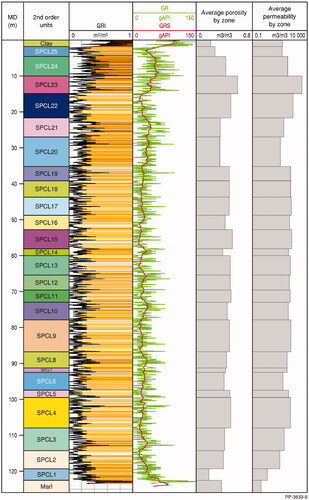
Figure 15. Total silicates (from XRD results) versus depth. In detail, the plot of total silicates versus depth shows repeated cycles of silicate-rich (5–6 wt%) to silicate poor (1–2 wt%) variations, with length-scales of ∼10 to <5 m.
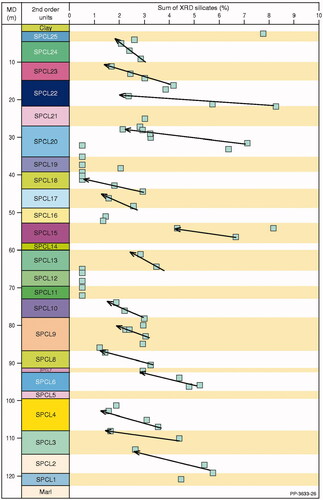
Figure 16. Left: Bioturbated semi-consolidated bioclastic muddy sand with shrinkage artefacts (blue cracks). Right: Lumpy bioclastic limestone with semi-indurated lumps in a matrix of bioclastic sand. Lateral field of view in each image is 23 mm. Both sections are from SPCL24.
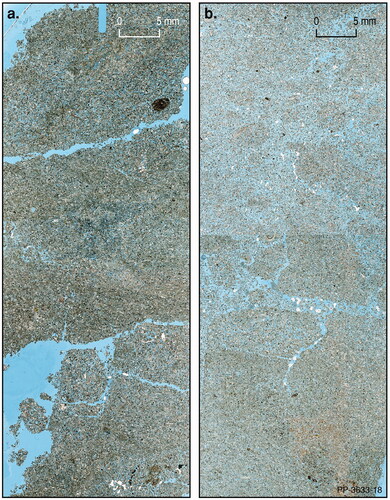
Figure 17. Overview of carbonates in the Port Campbell Limestone and Gellibrand Marl examined in thin-section.
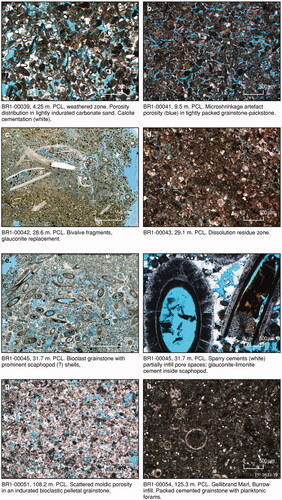
Figure 18. Comparison of Port Campbell Limestone bioclastic grainstone from Nullawarre 3. Blue resin indicates porosity. Nullawarre 3 core 1 (a) and core 2 (b) (). Both samples show porous bioturbation traces and spreite, but the carbonate of core 1 has much less cementation and higher porosity than the grainstone in core 2. Microstructures of the bioclastic grainstones in core 1 has high moldic porosity (c) and core 2 is indurated by calcite cements (d) in Nullawarre 3.
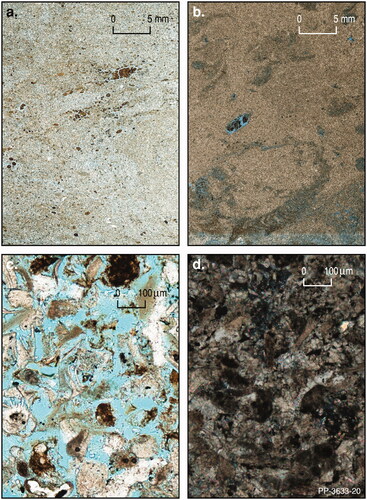
Figure 19. Plots of TiO2, K2O, La, Zr, Th, Yb, Nb, U and Cs versus Al2O3. Blue squares and yellow circles = Port Campbell Limestone (high- and low-U, respectively), and orange diamonds = Gellibrand Marl. Note the good positive correlation between Al2O3, which provides a measure of the detrital component in the rocks, and the majority of elements suggesting that the abundances of most elements are largely a function of the amount of detrital material in the Port Campbell Limestone (and Gellibrand Marl). One exception is U, which shows a range of behaviour versus Al2O3. Low-U samples (<2 ppm U, designated by the circles) show a good positive correlation with Al2O3, suggesting control by the detrital input. In contrast, the high U subgroup (highlighted) show a complete decoupling from Al2O3 and most other elements suggesting an additional control on U concentration.
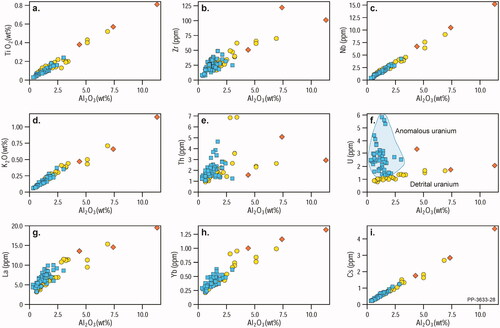
Figure 20. U (ppm) versus Al2O3 (wt%) and Th (ppm). Note the two distinct trends, with detrital U (correlated with both Al2O3 and Th) versus U from a secondary source (decoupled from both Al2O3 and Th; see ).
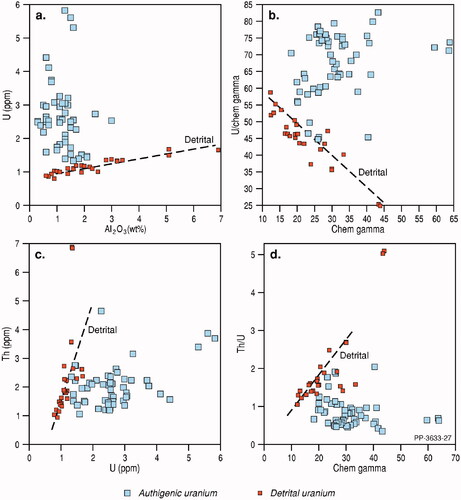
Figure 21. Percentage planktics in Brumbys 1 plotted with the %carbonate. Olive toned horizons are marls (wackestones) or marly limestones (wackestones/packstones) that alternate with limestones white) packstones/grainstones. Estimates of paleodepths are in red. Biochron., biochronology. The oxygen isotope curve is the ‘Megasplice’ of De Vleeschouwer et al. (Citation2017).
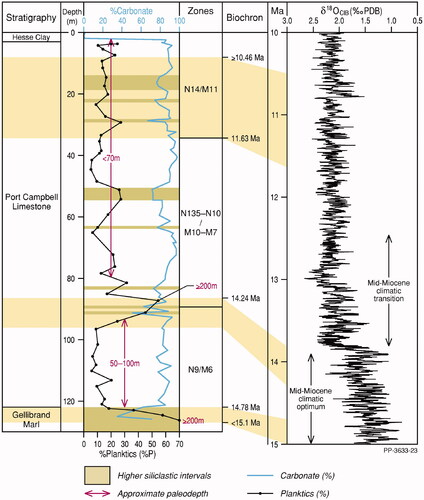
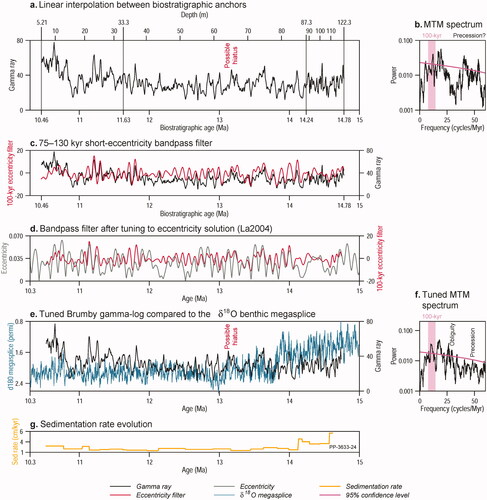
Figure 22. Cyclostratigraphic analysis of Brumbys 1 gamma-ray series. (a) Gamma log in the depth-domain and along a simple biostratigraphic age model. (b) Multitaper method (MTM) power spectrum of the gamma-ray signal, along its biostratigraphic age–depth model. (c) Bandpass-filtered signal (75–130 kyr bandwidth) extracting gamma-ray signal components that could be related to ca 100 kyr short eccentricity. (d) The bandpass filter after tuning to the La2004 eccentricity target curve (Laskar et al., Citation2004). (e) Cyclostratigraphically refined gamma-ray time series compared with the benthic δ18O megasplice of De Vleeschouwer et al. (Citation2017). (f) MTM power spectrum of the gamma-ray signal, along its cyclostratigraphic age–depth model. (g) Evolution of sedimentation rates in the cyclostratigraphic age–depth model throughout the studied interval.
Supplemental Material
Download PDF (203.3 KB)Data availability statement
The data that support the findings of this study are openly available at Geoscience Australia at https://dx.doi.org/10.26186/146045