
Figures & data
Figure 1. (a) Sm–Nd isotope map of the Yilgarn Craton (Lu et al., Citation2022), (b) geological map of the EGST terranes and (c) simplified rift geometry for the Eastern Goldfields.
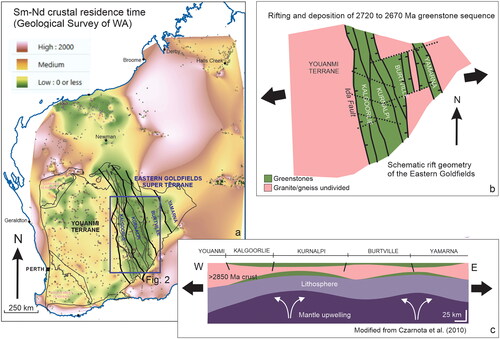
Figure 2. (a) Geological map of the EGST terranes and (b) stratigraphy of the Kalgoorlie Terrane.
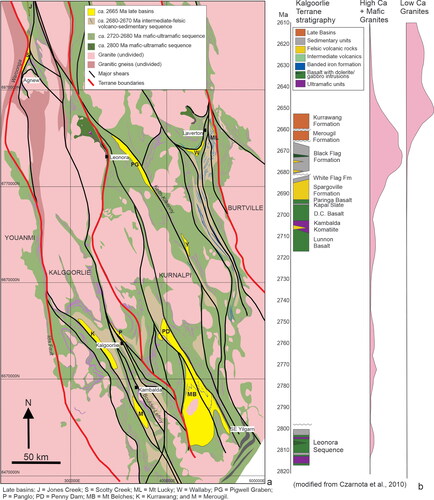
Figure 3. Late basin sedimentary rocks: (a) localities of late basins in the Eastern Goldfields; (b) rounded clasts in polymict conglomerate in drill core from Scotty Creek Formation, Agnew district, Wallaby Conglomerate, Laverton district and Merougil Formation, Kambalda; (c, d) basal Scotty Creek Formation in, and adjacent to, the D1 Emu Shear, Agnew; (e) well-developed upright north-trending S2 foliation overprints bedded units in Scotty Creek Formation, Agnew; and (f) flattened clasts in strongly foliated polymict Mt Lucky Conglomerate, Laverton district.
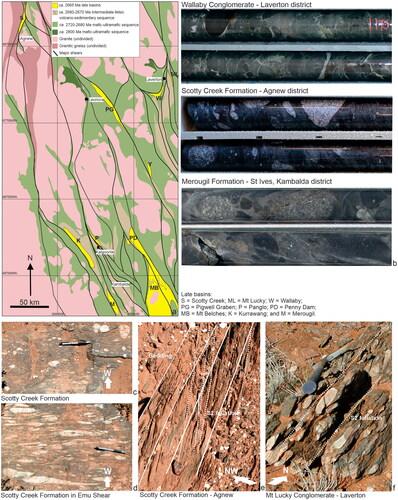
Figure 4. Regional pattern of metamorphic facies across the EGT (modified from Binns et al., Citation1976).
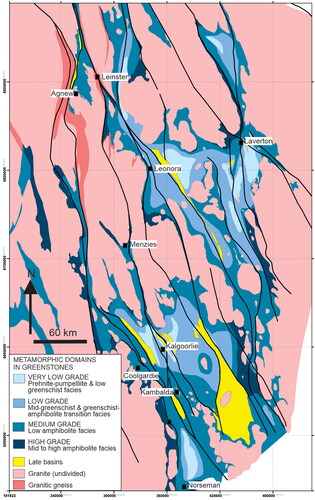
Figure 5. Summary of deformation schemes for the Eastern Goldfields.
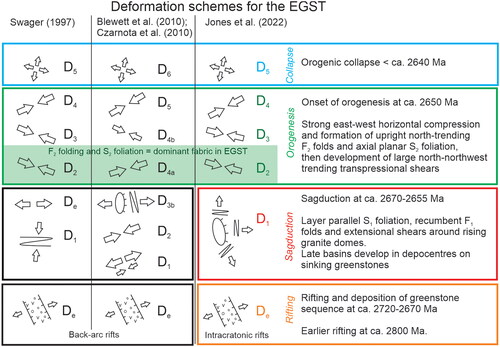
Figure 6. Locality map for images in following .
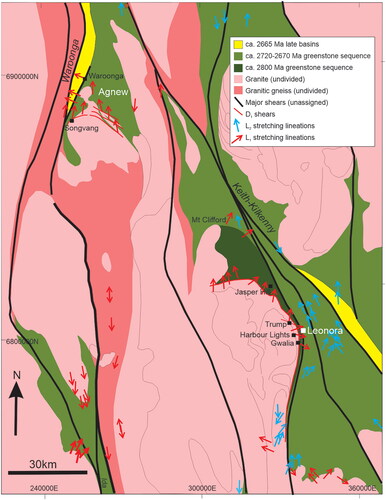
Figure 7. D1 vs D2 structures (localities shown in ): (a) flat-lying S1 foliation, Trump pit, Leonora; (b) flat-lying S1 foliation close to granite contact, Agnew district; (c) recumbent F1 fold, Jasper Hill, Leonora district; (d) recumbent F1 fold, southeast Yilgarn; (e, f) typical outcrops of upright north-trending S2 foliation, Kalgoorlie district; (g) upright north-plunging F2 folds, southeast Yilgarn; and (h) upright north-plunging F2 folds, Jasper Hill, Leonora district.
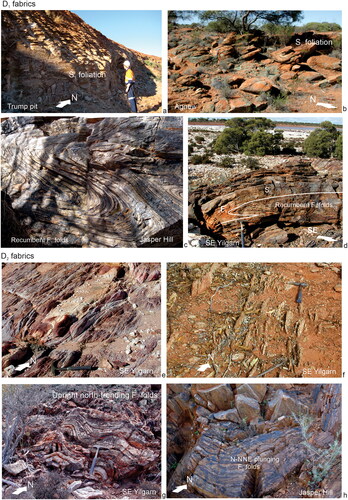
Figure 8. D1 extensional shears (localities shown in ): (a) extensional shears in the carapace of Raeside Batholith, Trump pit, Leonora; (b) Sons of Gwalia (SOG) Shear, Gwalia pit, Leonora; (c) extensional kinematics in SOG shear, Harbour Lights pit, Leonora; and (d) extensional shearing on Emu Shear, Waroonga mine, Agnew.
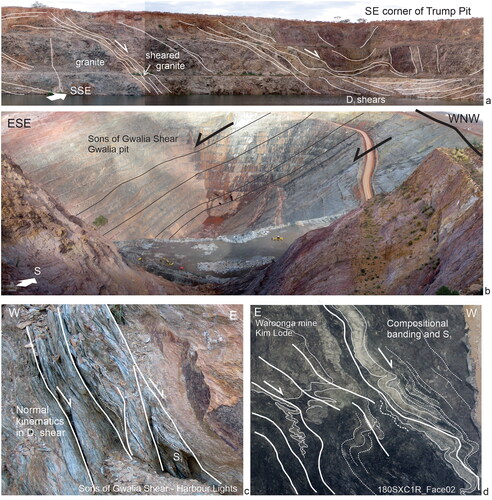
Figure 9. D1 fabrics overprinted by D2 fabrics (localities shown in ): (a) upright F2 fold in sedimentary unit, southeast Yilgarn; (b) oriented petrographic sample from previous outcrop shows the early bedding-parallel S1 foliation is folded by the upright F2 folds; (c) L0–2 intersection lineation trace of S2 overprints L1 lineations on the S0 surface, Jasper Hill, Leonora; (d) L1 lineations are folded by upright F2 folds, southeast Yilgarn; and (e, f) flat-lying S1 foliation in basalt is folded by upright F2 folds, Songvang pit, Agnew.
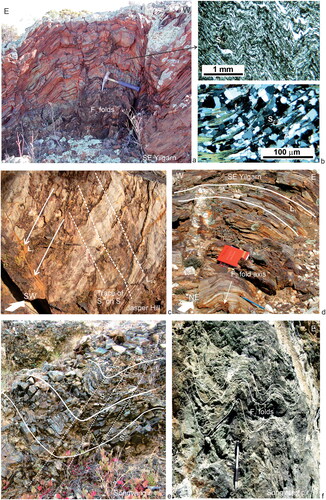
Figure 10. Foliation trajectory maps of the Leonora–Laverton and Kalgoorlie districts show that the north- to north-northwest-trending S2 foliation is the dominant fabric, particularly in the Kalgoorlie district. However, S1 foliation and D1 shears are well preserved in D2 strain shadows around the major granite bodies such as the area east of the Raeside Batholith, above the Mt Margaret Dome, around the Bali Dome and south of the Siberia, Owen and Scotia domes. Younging directions typically face away from the granite domes.
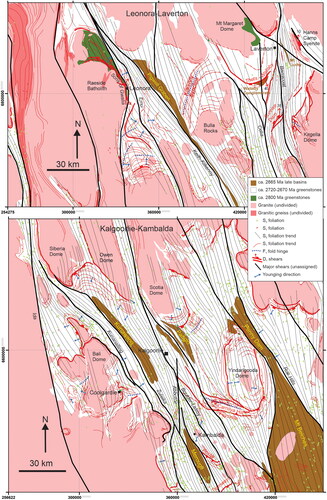
Figure 11. L1 and L2 lineation trends for the Eastern Goldfields. L1 lineations in this study represent stretching lineations measured on S1 and bedding surfaces, while L2 stretching lineations are observed on the steep S2 foliation and intersection lineations are excluded. L2 lineations typically trend north-northwest or south-southeast and are best developed in high-D2-strain zones adjacent to the major shears. In contrast, L1 lineations display more random trends and are not preserved in the high-D2-strain zones.
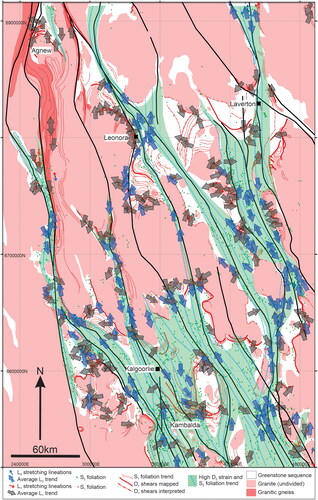
Figure 12. Schematic 3D cartoons illustrate the development of D1 event (sagduction) and the effects of later horizontal east–west compression (D2 event).
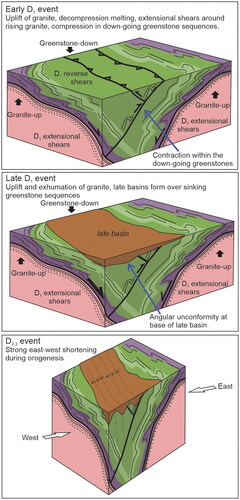
Figure 13. A linear belt of granitic gneiss with shallow stretching lineations observed along the western margin of the Eastern Goldfields, extending up to the Waroonga Shear at Agnew. Direct dating of these gneissic fabrics indicates an age range from 2670 to 2660 Ma (Zibra et al., Citation2022). Identical shallow north-plunging L1 stretching lineations are observed on the D1 Songvang Shear at Agnew and have recently been dated at 2661 ± 8 Ma (Thébaud et al., Citation2018).
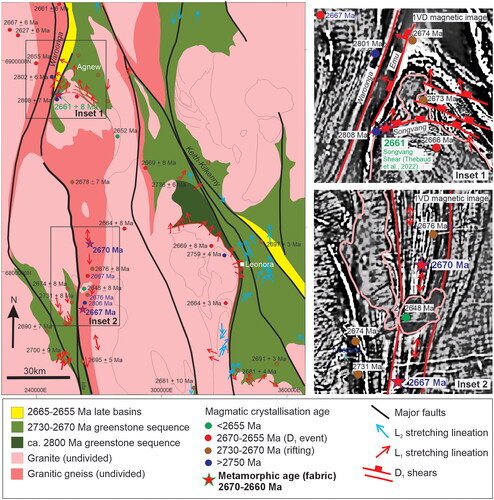
Figure 14. Development of dome-and-basin geometry in the Eastern Goldfields as a result of sagduction within the ca 2730–2670 Ma rift zone: (a) during the initial phase of sagduction, the felsic crust rises, forming granite domes while greenstones sink with a radial pattern of L1 lineations developing around the rising domes; and (b) at a later phase of sagduction, depocentres develop on the sinking greenstones with deposition of widespread late basin sequences. Zones of strong north–south L1 lineations on the edges of the original rift suggest development of ‘escape’ structures as a result of increasing east–west constriction from the rising domes.
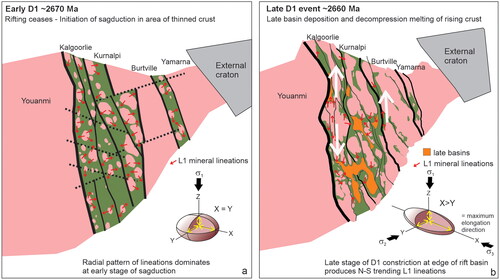
Figure 15. Timeline for the changing tectonic regimes in the Eastern Goldfields, from rifting, sagduction and later orogenesis. Granite and gold age ranges from Blewett et al. (Citation2010) and Czarnota et al. (Citation2010).
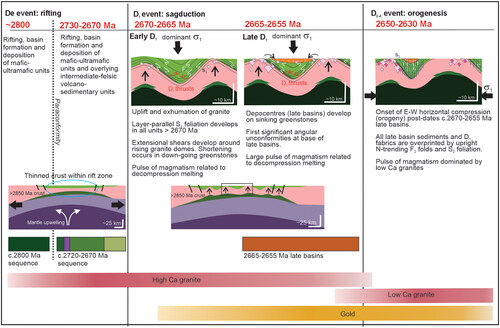
Figure 16. Contrasting structural styles of gold deposits in the Leonora area: (a) location map; (b) Sons of Gwalia (SOG) shear in Gwalia pit; (c) foliation drag indicates extensional displacement on the SOG shear in Gwalia pit; (d) tightly folded lodes of the Gwalia deposit within the SOG shear; (e) large recumbent F1 folds in the hanging wall of the SOG shear, Harbour Lights pit; (f) foliation drag indicates extensional movement on the SOG shear, Harbour Lights pit; and (g–k) gold is hosted in veins and shears in the deformed carapace of a granite body. Sinistral movement is observed on flat-lying lodes developed on the top of the granite body, and on the steep lodes and breccia veins along the eastern side of the granite body.
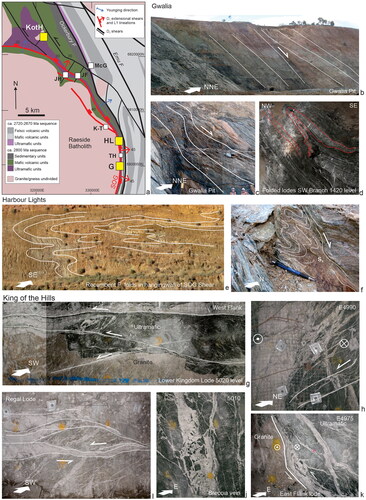
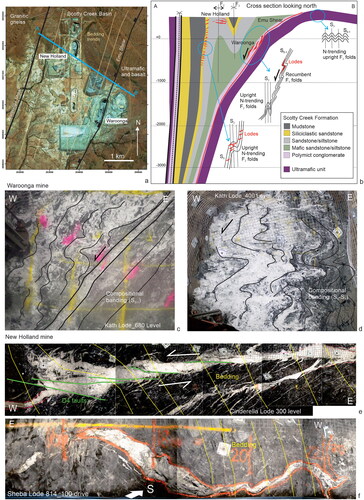
Figure 17. Contrasting structural styles of gold deposits in the Agnew area: (a) location of Waroonga and New Holland deposits in the Scotty Creek basin; (b) cross-section illustrates the location and very different structural setting of lodes at Waroonga vs New Holland; (c, d) at Waroonga, gold is hosted in the layer-parallel extensional D1 Emu Shear with recumbent F1 drag folds indicating west-side-down displacement; (e) at New Holland, gold is hosted in flat-lying lodes that cut across steep to sub-vertical bedding; and (f) at depth in the New Holland mine, open upright folds develop in the lodes, indicating progressive deformation during prolonged east–west horizontal compression.
Data availability statement
Much of the raw data that support the findings of the study were generated at the Geological Survey of Western Australia and are available in GeoVIEW.WA software or in the 1:100 000 and 1:250 000 map sheet series in the eBookshop.