
Figures & data
Figure 1. Distribution map of rare earth deposits in northeast China.
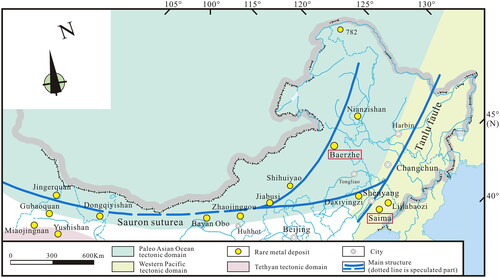
Figure 2. Geological map of Saima uranium–thorium–niobium polymetallic deposit (modified after Ju et al., Citation2019).
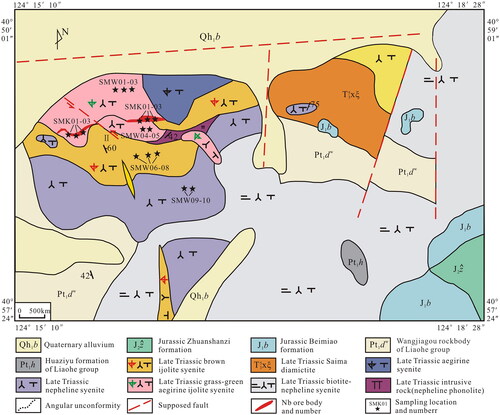
Figure 3. Representative outcrop-pictures and photomicrographs of the ore-forming rocks in Saima niobium deposit. (a) Nepheline syenite; (b) aegirine syenite (containing niobium and tantalum); (c) aegirine syenite; and (d) aegirine syenite. Mineral abbreviations: Aeg, aegirine; Bt, biotite; Kfs, K-feldspar; Ne, nepheline.
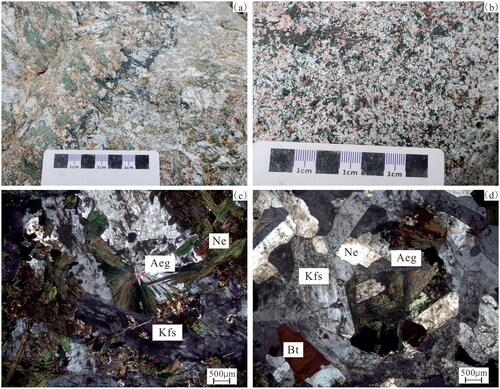
Figure 4. Geological map of the Baerzhe rare earth deposit (modified after Yang, Sun, et al., Citation2012).
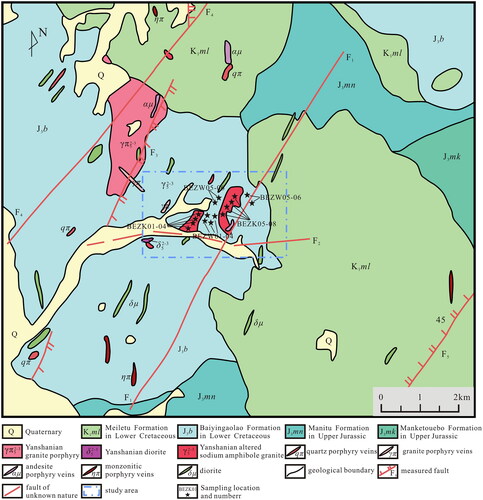
Figure 5. Representative outcrop-pictures and photomicrographs of the ore-forming rocks in Baerzhe deposit. (a) Alkali feldspar granite; (b) alkali feldspar granite (ore); (c) alkali feldspar granite; (d) alkali feldspar granite; (e) alkali feldspar granite (hornblende is metasomatised by zircon); and (f) alkali feldspar granite.
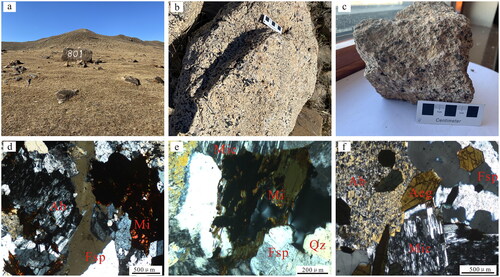
Figure 6. (a) Zircon U–Pb concordia diagram and (b) zircon CL image from nepheline syenites in the Saima niobium deposit.
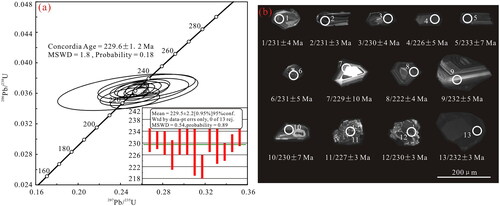
Figure 7. Major elements of plutons from the Saima and Baerzhe deposits. (a) Magmatite TAS diagram (after Middlemost, Citation1994); (b) A/NK–A/CNK diagram (after Maniar & Piccoli, Citation1989); (c) FAM diagram; and (d) FeOt/(FeOt + MgO)–SiO2 diagram.
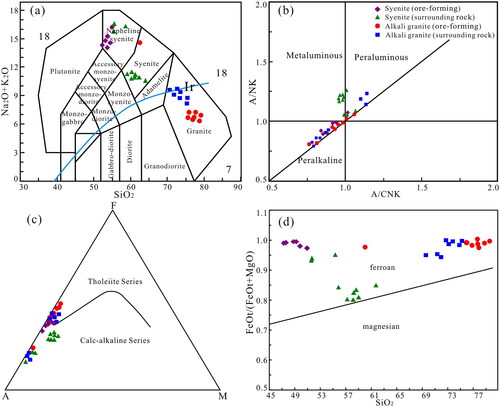
Figure 8. Chondrite-normalised trace element patterns and primitive mantle-normalised spider diagrams samples from the (a, b) Saima and (c, d) Baerzhe deposits (normalisation values after Boynton Citation1984; primitive mantle-normalised values after Sun and McDonough Citation1989).
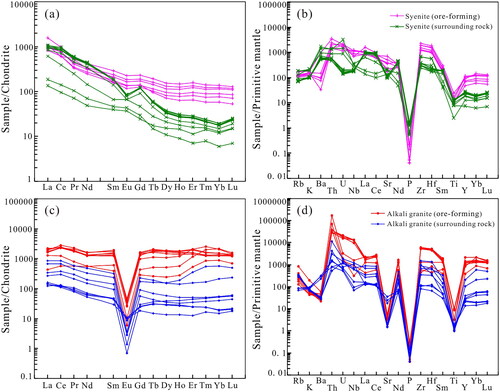
Figure 9. Discrimination diagrams of ore-forming samples from the Saima and Baerzhe deposits [after Whalen et al., Citation1987; the evolution trend line in (b) after M. Wu et al. Citation2017]. (a) (Na2O + K2O)–10 000Ga/Al; (b) Ce–10 000Ga/Al; (c) Zr–10 000Ga/Al; and (d) Yb/Ta–Y/Nb.
![Figure 9. Discrimination diagrams of ore-forming samples from the Saima and Baerzhe deposits [after Whalen et al., Citation1987; the evolution trend line in (b) after M. Wu et al. Citation2017]. (a) (Na2O + K2O)–10 000Ga/Al; (b) Ce–10 000Ga/Al; (c) Zr–10 000Ga/Al; and (d) Yb/Ta–Y/Nb.](/cms/asset/e3ea68da-015a-49e9-a7ff-d5757a0a83d9/taje_a_2353286_f0009_c.jpg)
Figure 10. Magmatic source area discrimination diagrams of samples from the Saima and Baerzhe deposits (EMI, EMII, HIMU and Primitive after Zindler and Hart, Citation1986; lower crust, mantle after Zartman and Doe Citation1981): (a) ISr–εNd(t); (b) 207Pb/204Pb–206Pb/204Pb; (c) 207Pb/204Pb–206Pb/204Pb; and (d) 208Pb/204Pb–206Pb/204Pb.
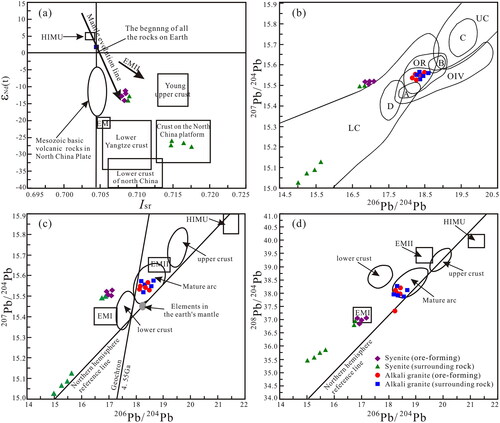
Figure 11. Tectonic setting discrimination diagrams of samples from the Saima and Baerzhe deposits. (a) Ta–Yb (after Pearce et al., Citation1984); (b) Rb–(Y + Nb) (after Pearce et al., Citation1984); (c) log(CaO/(Na2O + K2O))–SiO2 (after Brown et al., Citation1984); and (d) R1–R2 (after Brown et al., Citation1984).
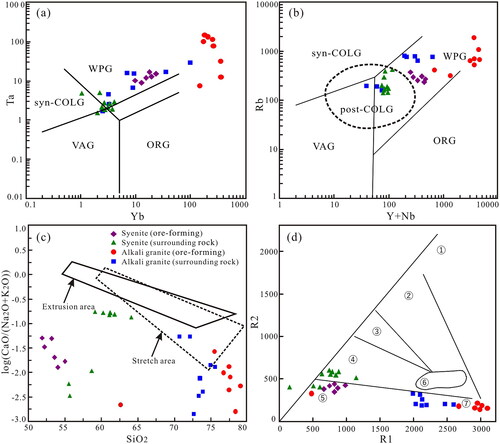
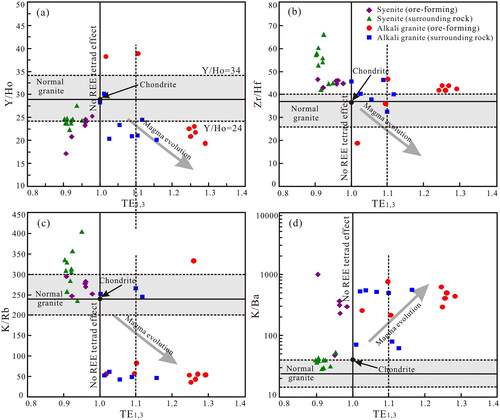
Figure 12. Numerical modelling diagrams for trace elements of samples from the Saima and Baerzhe deposits (modified after Xu et al., Citation2015). (a) Y/Ho–TE1,3; (b) Zr/Hf–TE1,3; (c) K/Rb–TE1,3; and (d) K/Ba–TE1,3. Amp, amphibole; Bt, biotite; Grt, garnet; Kf, K-feldspar; Ms, muscovite; Pl, plagioclase.
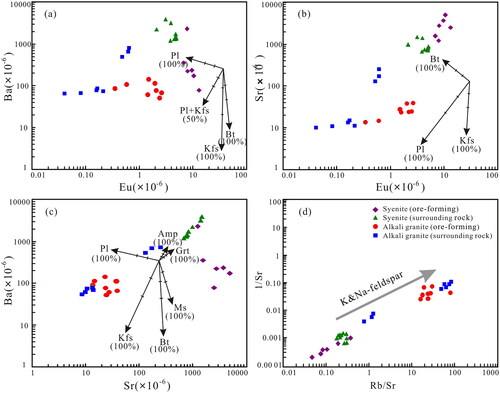
Figure 13. Discrimination diagrams for degree of magma evolution for samples from the Saima and Baerzhe deposits (after F. Y. Wu et al., Citation2021): (a) Ba–Eu; (b) Sr–Eu; (c) Ba–Sr; and (d) 1/Sr–Rb/Sr.
Supplemental Material
Download MS Excel (54 KB)Data availability statement
The authors confirm that the data supporting the findings of this study are available within the article supplemental data files.