Figures & data
Figure 1. Typical fixation stimuli, adapted for red-green anaglyph display. Actual stimuli were greyscale. A: Zero disparity. B: overlapping targets for the left and right eyes. Participants were instructed that this percept was not considered “double”. C: Separated targets, which are considered “double” if seen. (A movie of a typical break-inducing sequence is available at this link: https://youtu.be/e_-CrM14XwU).
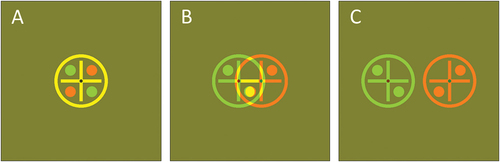
Figure 2. Eye tracking data from author TYG, for measuring convergence with stimuli moving at 2 Δ/s. A: Horizontal on-screen position of stimuli (purple/blue) and estimated gaze point (red/green) over time. B: Target separation (blue line), target diameter (blue shading), and smoothed gaze vergence (black). The magenta and cyan diamonds indicate break and recovery points identified by automated analyses.
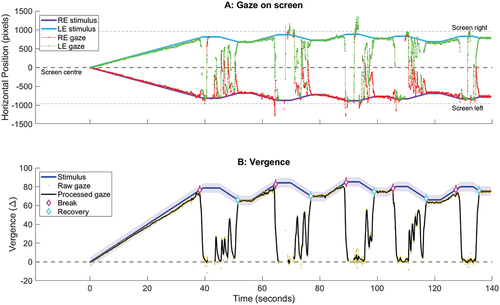
Figure 3. Plots of objective versus subjective break points measured for A-C: convergence and D-F: divergence. Data are from 29 participants and were collected with stimuli moving at: (a,d) 0.5, (b,e) 1.0 and (c,f) 2.0Δ/s. Error bars show 95% confidence intervals, the red line is the unity line, the grey line is the best-fitting straight line. indicates outliers (where the difference between subjective and objective estimates fell more than 3 standard deviations from the mean difference).
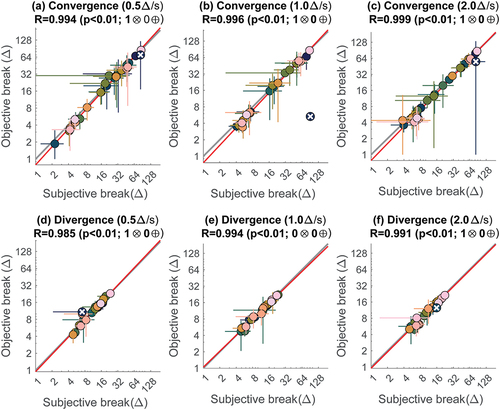
Figure 4. Plots of objective versus subjective recovery points measured for (a-c) convergence and (d-f) divergence. Plotting conventions are as , but in addition indicates one participant with poor convergence recovery (<1δ), which falls out of range for this log-scale plot.
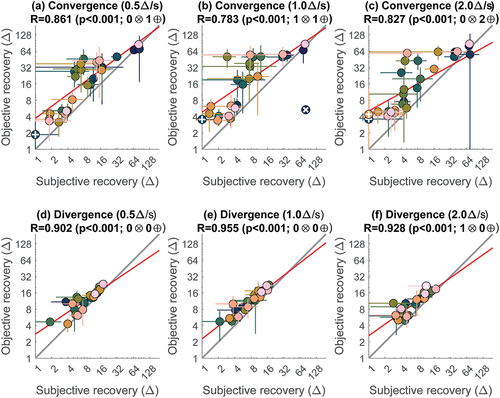
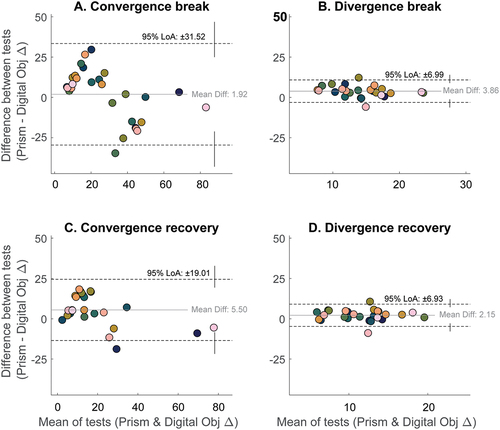
Figure 5. Bland-Altman plots of fusional range estimates made using prism bars or objective responses from the digital test (1.0 Δ/s condition). Participant colour codes are as .