Figures & data
Figure 1. Diagram of the Swiss Liquid Jet Corneal Sensitivity Aesthesiometer (SLACS).
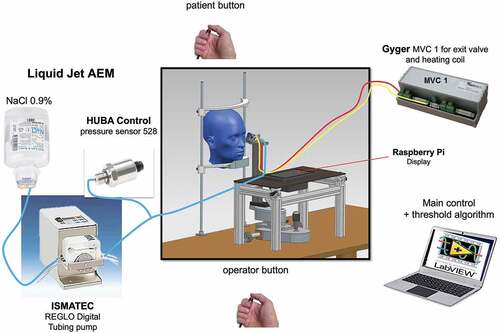
Table 1. Descriptive data for overall corneal sensitivity threshold measurements with SLACS and CB: medians/interquartile ranges.
Table 2. Descriptive data for individual corneal sensitivity threshold measurements with SLACS and CB: medians/interquartile ranges.
Figure 2. Bland Altman with bootstrap limits of agreement plots showing within visit (to the left) and between visit repeatability (to the right) for SLACS: bold lines for means; thin lines for 95% confidence intervals of the means; dotted lines for the lower and upper limits of CoR with their 95% confidence intervals.
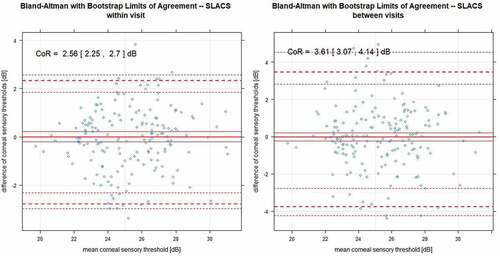
Figure 3. Bland Altman with bootstrap limits of agreement plots showing within visit (to the left) and between visit repeatability (to the right) for CB: bold lines for means; dotted lines for the lower and upper limits of CoR with their 95% confidence intervals.
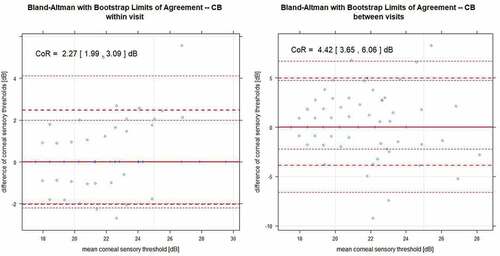
Table 3. Bland Altman analysis for the differences in measurements [dB] within and between visits (type) for groups A and B, as well as for the overall group: mean [CI], CoR [CI], lower limit [CI] and upper limit [CI].
Figure 4. Estimated median values and Hodge Lehman 95% confidence intervals for corneal sensory thresholds for SLACS and CB for the overall group for all four measurements separately, obtained with a bootstrap method.
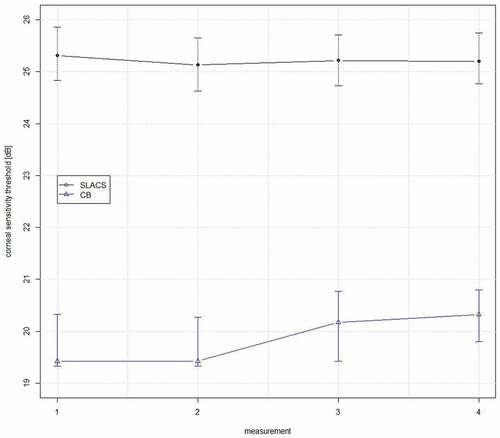
Figure 5. Correlation between SLACS and CB for sensory thresholds for the overall subject group.
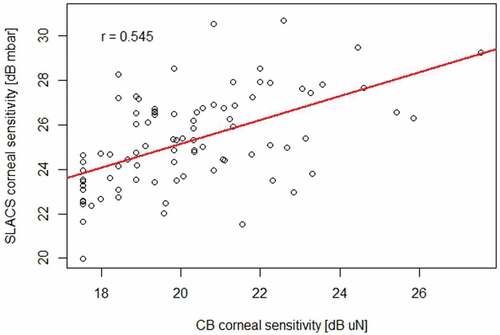
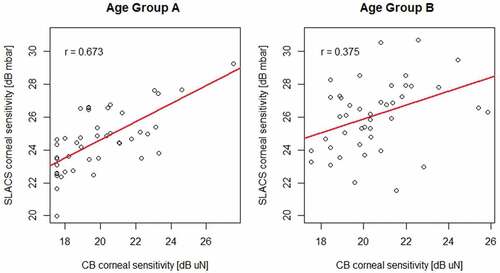
Figure 6. Correlations between SLACS and CB for sensory thresholds for Group A and B separately.