Figures & data
Figure 1. Chart stimuli used for assessing visual acuity. Top left is a chart used when aniseikonia was induced with size lenses. Top right is a screen shot of a chart used when aniseikonia was simulated by vectographic presentation on a computer monitor. The bottom is an image of the 3D monitor with vectographic stimuli through the right lens of polaroid spectacles. For illustration purposes, this is set at a reduction of 40% in one of the images, which is twice the largest reduction used in the study.
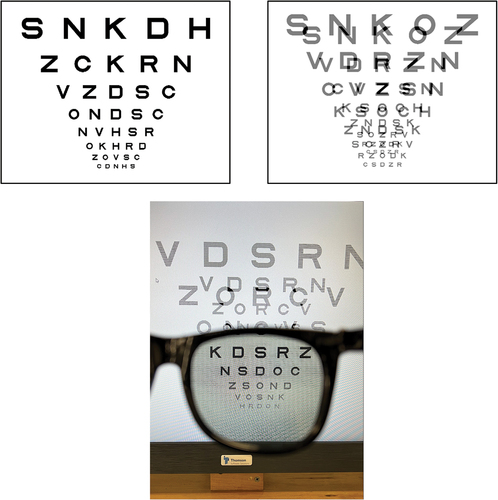
Figure 2. Effects of aniseikonia induced by size lenses on mean acuity for A: chart based optotypes, and B: isolated presentations of optotypes. Error bars represent 95% confidence intervals for the mean. Smaller images presented to the left eye are shown on the left side of the figures, and smaller images presented to the right eye are shown on the right side of the figure. Monocular thresholds are indicated by the horizontal line and error bar on the right axis. Points significantly higher than monocular thresholds are indicated by an asterisk. Orange point represents the zero induced condition.
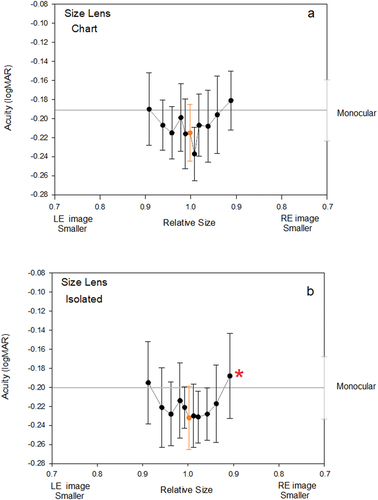
Figure 3. Vectographic presentation of stimuli: Effects of aniseikonia induced on mean acuity for A: chart based optotypes, and B: isolated presentations of optotypes. Graphing conventions are the same as for .
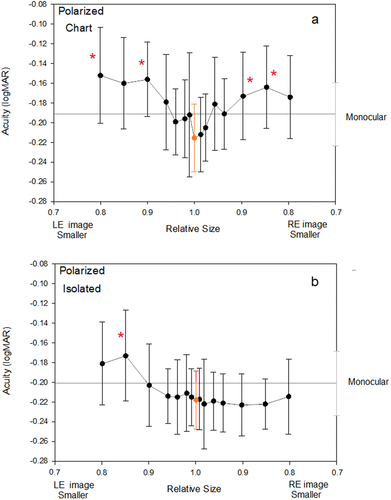
Figure 4. Visual acuity plotted against relative image size for individual participants. Size lens presentations are on the left, vectographic presentation are on the right. Chart based measurements are in the upper frames and isolated optotype measurements are in the lower frames.