
Figures & data
Table 1. Location, region and place of work by occupation.
Figure 1. Self-reported confidence scores for assessing children in general (left) and children with learning difficulties (right) presented by occupation. Confidence scores were calculated by averaging responses to statements related to comfort, expertise, and knowledge and ranged from one (low) to five (high confidence). Boxes indicate median and interquartile range with whiskers extending to 5th and 95th centiles.
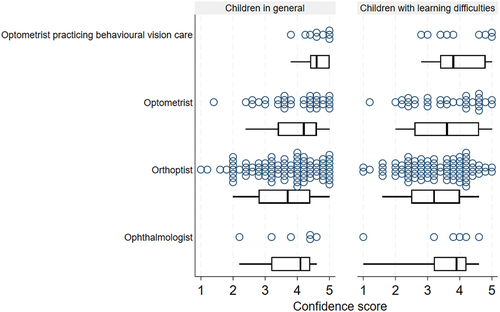
Figure 2. Correlation between self-reported confidence score for assessing children in general and children with learning difficulties. Confidence scores for both ranged from one (low confidence) to five (high confidence). ρ = Spearman’s correlation coefficient.
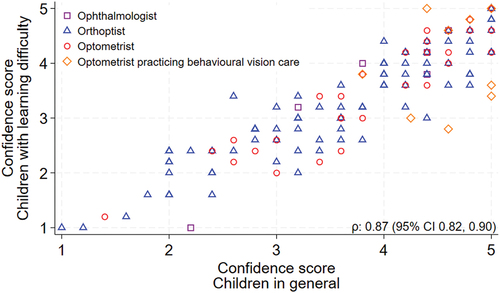
Table 2. Components of clinical assessment undertaken when assessing children with learning difficulties by occupation.
Table 3. Accommodation, convergence and fusional vergence.
Table 4. Referral patterns of eye health care professionals when assessing with children with learning difficulties.