
Figures & data
Figure 1. The distribution of the difference in visual acuity, subjective quality of distance vision rating and subjective ease of adaptation rating between the two test prescriptions.
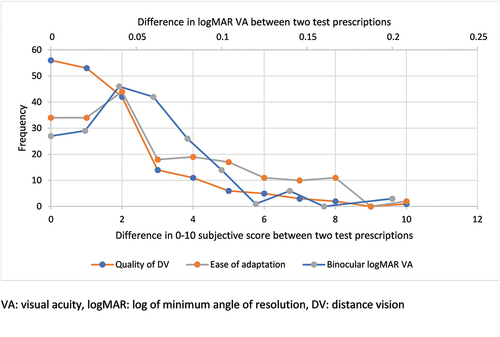
Figure 2. Percentage of participants who preferred the higher scoring (better subjective quality of distance vision or ease of adaptation rating or better logMAR VA) prescription.
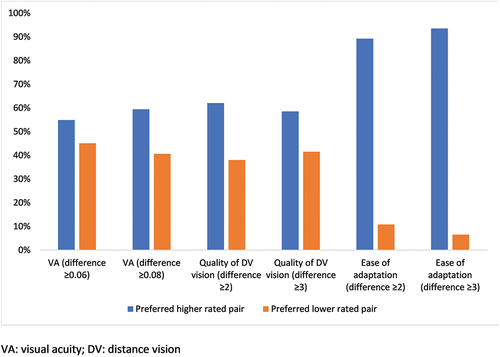
Table 1. Wilcoxon signed rank test, scores between preferred and non-preferred prescriptions.
Table 2. Logistic regression model of the variables which best predicted whether the participant answered yes to the question ‘if you had purchased these spectacles for $100, would you be happy with them?’