Figures & data
Table 1. List of abbreviations.
Figure 1. Retinal vasculature and anomalies evident when using OCT-A and other imaging modalities. The OCT b-scan image is separated into various slabs: the inner vascular regions incorporating the superficial (SCP) and deep capillary plexus (DCP: red region), followed by the avascular region (blue) and finally the vascular (red) choriocapillaris. The SCP within the superior vascular slab extends from the ILM to the posterior IPL while the DCP extends from the posterior IPL to the anterior ONL. Only the SCP and DCP are shown as per CIRRUS OCT nomenclature. There is an intermediate capillary plexus that straddles the SCP and DCP which some OCT instruments include. (A) Fundus photograph of a healthy right eye. OCT-A imaging of the (B) superficial capillary plexus showing the foveal avascular zone, (C) deep (deep capillary plexus) and (D) outer retina to choriocapillaris (ORCC) of a normal eye. (E) Red-free image of a patient with proliferative diabetic retinopathy in the left eye. The yellow line shows the location of the OCT b-scan derived from the OCT-A cube. (F) OCT b-scan shows the neovascularisation located pre-retinally (yellow arrow). The vitreoretinal interface slab lines are defined by the pink dashed lines. (G) VRI (vitreoretinal interface) OCT-A image shows two regions of neovascularisation (yellow boxes). (H) Red-free image of a patient with a history of proliferative diabetic retinopathy managed with peripheral pan-retinal photocoagulation in the right eye. The yellow line shows the location of the OCT b-scan derived from the OCT-A cube. (I) OCT b-scan shows focal inner retinal thinning temporally (yellow oval). (J) The focal inner retinal thinning corresponds to a region of reduced capillary density (yellow box) on the superficial OCT-A image. (K) Fundus photograph of a patient with acute central serous chorioretinopathy and associated pachychoroid neovasculopathy in the left eye. The yellow line shows the location of the OCT b-scan derived from the OCT-A cube. (L) OCT b-scan shows subretinal fluid overlying a flat irregular pigment epithelial detachment (FIPED). (M) ORCC OCT-A image shows a neovascular network centrally (yellow box) displaying a bright vascular network surrounded by a duller region before continuing to a normally appearance for the ORCC. (N) Abbreviations: superficial and deep capillary plexus (SCP and DCP); RNFL – retinal nerve fibre layer; GCL – ganglion cell layer; IPL – inner plexiform layer; INL – inner nuclear layer; OPL – outer plexiform layer; ONL – outer nuclear layer; PR – inner and outer segments of photoreceptor layer; RPE – retinal pigment epithelium.
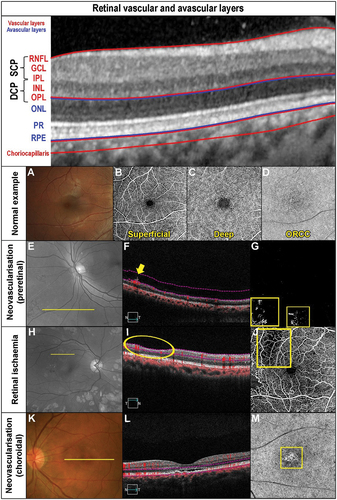
Figure 2. Longstanding cilioretinal artery occlusion in the left eye of a 51-year-old male (Case 1). (A) No evidence of a retinal embolus with colour fundus photography. (B) Red-free fundus photography highlights a papillomacular retinal nerve fibre layer defect (asterisk). (C) Horizontal OCT imaging demonstrates focal thinning of the retina (blue hue) corresponding to the affected area (arrow) located primarily superior-nasally to the fovea. (D) Nasal focal inner retinal thinning and disorganisation (yellow bracket) on OCT line scan through the superior macula. (E) 6 × 6OCT-A superficial slab (defined as inner limiting membrane to posterior inner plexiform layer) and (F) 6 × 6OCT-A deep slab (defined as posterior inner plexiform layer to posterior outer plexiform layer). Both superficial and deep capillary plexuses display reduced capillary perfusion (yellow oval). (G) Corresponding inferotemporal defect of the left eye with the 10–2 visual field test grid (grey scale is shown).
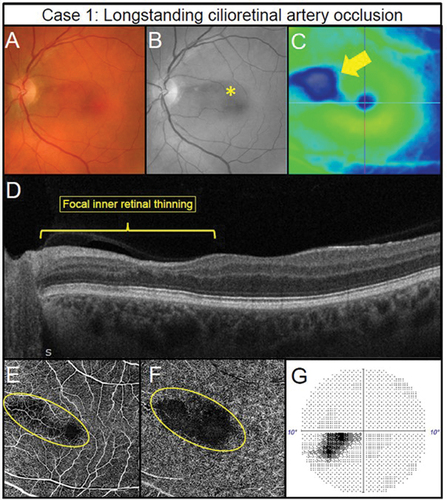
Figure 3. Pre-retinal neovascularisation associated with a longstanding superior branch retinal vein occlusion treated with retinal photocoagulation laser in a 65-year-old male (Case 2). (A) Subtle pre-retinal neovascularisation located between regions of laser (oval) with ultra-widefield imaging. (B) Green separation channel highlights the region of neovascularisation. (C) OCT line scans through the region of neovascularisation shows pre-retinal abnormal hyper-reflective tissue along the posterior interface (arrow). (D) Scanning laser ophthalmoscope image of the OCT-A scan location (rectangle). (E) Retinal nonperfusion suggestive of retinal ischaemia present superiorly (asterisk) with 3 × 3 mm OCT-A image of the deep capillary plexus (defined as posterior inner plexiform layer to posterior outer plexiform layer). Impaired retinal perfusion is also present in the inferior aspects of the scan. (F) Pre-retinal neovascularisation (oval) in the region of non-perfusion noted in the previous panel detected using 3 × 3 mm OCT-A imaging of the vitreoretinal interface (defined as user-defined anterior border set in the vitreous space to the inner limiting membrane).
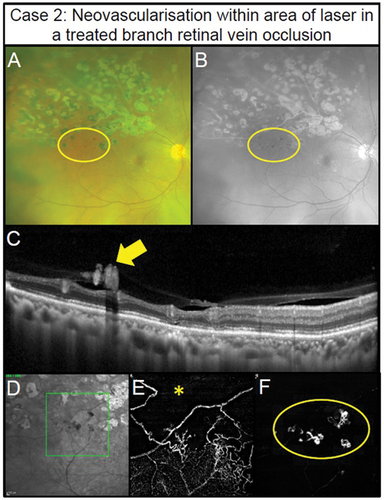
Figure 4. Manifestations of diabetic retinopathy. (Case 3) Mild non-proliferative diabetic retinopathy (NPDR) in the left eye of a 40 -year – old male. (A) Isolated microaneurysm present in the nasal macula (arrow) using colour fundus photography. (B) Improved visualisation of microaneurysm with the red-free filter (arrow). (C) 6 × 6 mm OCT-A superficial capillary slab (defined as inner limiting membrane to posterior inner plexiform layer) highlights the microaneurysm noted on fundus photography (yellow circle) and an additional microaneurysm (red circle). (D) No visual abnormalities can be seen on structural OCT in the region matching the additional microaneurysm (rectangle). (Case 4) Foveal avascular zone enlargement associated with moderate NPDR in the left eye of a 37-year-old male. (E) Several microaneurysms and intraretinal haemorrhages centrally evident with colour fundus photography (arrowheads). (F) Visualisation of diabetic lesions enhanced with red -free filter (arrowheads). (G) Enlargement of foveal avascular zone (dashed line) (6×6 mm OCT-A superficial slab). (H) No visual abnormalities present on horizontal structural OCT through the fovea. (Case 5) Retinal ischaemia associated with severe NPDR in a 31 -year -old male. (I) Colour fundus photography shows numerous microaneurysms and intraretinal haemorrhages centrally. (J) Red-free filter displays enhanced visualisation of diabetic lesions. (K) Reduced capillary perfusion (asterisk) consistent with retinal ischaemia temporally in 6 × 6 mm OCT-A superficial slab. (L) Focal inner retinal thinning (bracket) corresponding to the region of reduced superficial capillary perfusion visualised using structural OCT. (Case 6) Focal proliferative diabetic retinopathy (PDR) within a region of retinal ischaemia in a 43-year-old. (M) Small abnormal vessel in the inferior mid-periphery (circle) using fundus colour photography. (N) Green separation channel improves visualisation of abnormal vessel (circle). (O) Reduced capillary perfusion surrounding the abnormal vessel (circle) detected using 12 × 12 mm OCT-A superficial slab (user-defined vitreous space to posterior inner plexiform layer). (P) Pre-retinal hyper-reflective tissue (arrowhead) corresponding to the abnormal vessel consistent with pre-retinal neovascularisation on structural OCT. (Case 7) Extensive PDR in a 55-year-old male involving the retina and posterior vitreous. The neovascular complexes can form fibrovascular sheets generating a posterior pre-cortical vitreous pocket forming a ‘wolf’s jaw’ configuration. The ‘wolf’s jaw’ configuration is evident in this case, with superior and inferior fibrovascular tissue evident in ultra-widefield imaging (Q) red-green channels and (R) green separation channel imaging. (S) 12 × 12OCT-A superficial slab shows abnormal frond-like vascular networks in the regions of fibrosis. (T) Pre-retinal hyper-reflective sheets (asterisks) with associated retinal distortion on structural OCT.
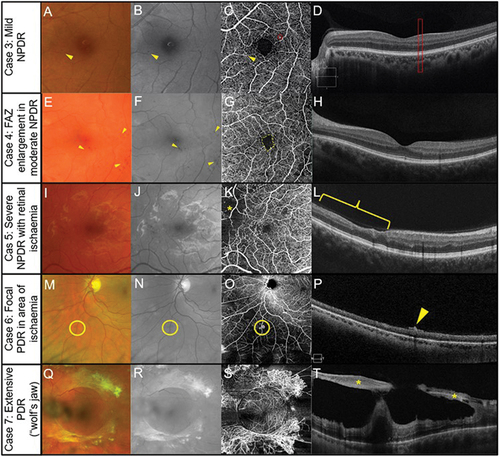
Figure 5. Multimodal imaging in inherited retinal dystrophies. Retinitis pigmentosa in a 40-year-old female (Case 8). (A) Fundus photography of the central retina. Outside this region, attenuated arterioles are present indicative of advanced stage of the disease process. The patient also has midperipheral spicule-like pigmentation not visible in the photograph. (B) Hyper-auto fluorescent ring around the macula (fundus autofluorescence imaging). (C) Subtle reduction in peripheral perfusion with 6 × 6 mm OCT-A superficial capillary slab (set from inner limiting membrane to posterior inner plexiform layer). (D) Impaired flow in the regions of outer retinal atrophy (outside the dashed yellow lines) with 6 × 6 mm OCT-A set at the level of the choriocapillaris (defined as 29 and 49 microns beneath the RPE). (E) Borders of preserved outer retina (yellow dashed lines) on structural OCT corresponding to borders of normal choriocapillaris flow on OCT-A corresponding to edge of remaining photoreceptors and the edge of the hyperfluorescent region in Figure 5B. The thinner retina outside the region identified by the yellow dashed line allows the deeper choroidal layers to be identified. (Case 9) Stargardt disease in a 62-year-old female. (F) Fleck-like fundus lesions with a region of outer retinal atrophy nasal to inferior to the fovea in the left eye. (G) Hypo-autofluorescence corresponding to the area of atrophy due to the loss of retinal pigment epithelial cells and the fleck-like lesions (hyper-auto fluorescent) are also more evident. (H) Subtle reduction in perfusion (yellow dashed region) in the area of atrophy detected using 6 × 6 mm OCT-A superficial capillary slab (set from inner limiting membrane to posterior inner plexiform layer). (I) 6 × 6 mm OCT-A choriocapillaris slab shows increased visibility of the choriocapillaris flow signal (yellow dashed region) corresponding to the area of atrophy. (J) Borders of atrophy delineated using structural OCT correspond to the region of flow impairment (yellow dashed lines). There is increased choroidal reflectance in the area of atrophy with a loss of photoreceptors and retinal pigment epithelium.
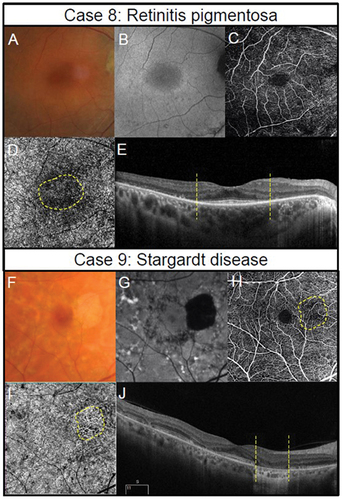
Figure 6. Two presentations of geographic atrophy with different rates of progression over a one-year-period. (Case 10) Slow progressing atrophy in a 71-year-old female with visual acuity of 6/15. (A) Medium and large drusen with focal geographic atrophy inferotemporal to the fovea in the right eye with colour fundus photography at baseline and follow-up visits. (B) Slight enlargement of hypo-autofluorescent area corresponding to an area of atrophy. (C) The areas where there is a subtle increase in flow signal demonstrates modest enlargement on 6 × 6 mm OCT-A image set at the choriocapillaris across visits (dashed lines). (Case 11) Fast progressing atrophy in an 83-year-old female with visual acuity of 6/19. (D) Medium and large drusen with pigmentary abnormalities and multiple areas of geographic atrophy demonstrating notable enlargement at follow-up. (E) Coalescence of hypo-autofluorescent regions between baseline and follow up. (F) 6 × 6 mm OCT-A image set at the choriocapillaris shows a greater extent of increased flow signal at baseline (dashed lines).
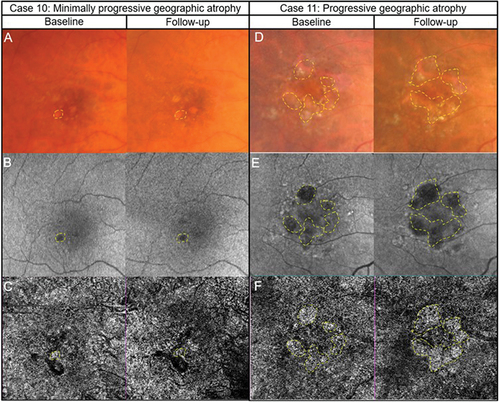
Figure 7. Two cases of likely choroidal macular neovascularisation detected with OCT-A imaging. (Case 12) a 78-year-old male with visual acuities of 6/95–2 right eye and 6.9/5 + 2 left eye referred for a macular assessment. His referring optometrist noted a recent drop in his right eye’s vision from 6/12 to 6/120. (A) The right eye’s colour fundus photograph shows large drusen at the macula. (B) Fundus autofluorescence imaging showed speckled central hypo-autofluorescence. (C) Structural OCT imaging showed subretinal fluid, intraretinal cystic spaces and subretinal hyperreflective material (yellow asterisk) at the fovea. (D) A neovascular network (yellow box) is noted on the 6 × 6 mm ORCC OCT-A image. (E) The reference lines on the central OCT b-scan from the OCT-A image cube is depicted by the pink dashed lines. (Case 13) a 56-year-old male with visual acuities 6/6 right eye and 6/19 (pinhole 6/15 + 1) left eye. There was generalised waviness across the central 10 degrees of the Amsler grid in the left eye. (F) Colour fundus photographs shows pigmentary abnormalities centrally in the left eye. (G) Fundus autofluorescence imaging shows central hypo-autofluorescence with surrounding hyper-autofluorescence at the left macula. (H) There was subretinal fluid overlying a flat irregular pigment epithelial detachment in the left eye on OCT imaging. The inset in the upper right-hand corner shows the OCT b-scan location. (I) A neovascular network (yellow box) is present on 3 × 3 mm macular OCT-A image of the ORCC slab. (J) OCT b-scan derived from the OCT-A image cube shows the slab reference points (pink lines).
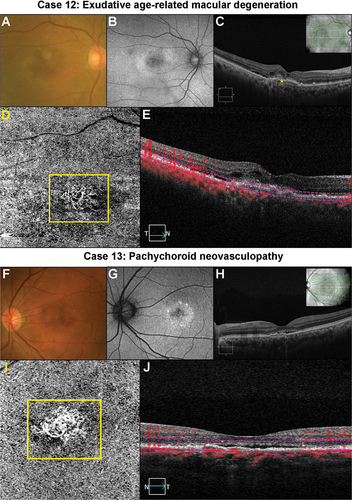
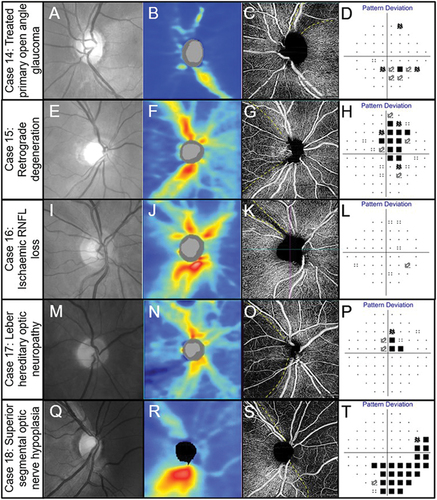
Figure 8. Spectrum of optic nerve head diseases. (Case 14) Primary open angle glaucoma in the left eye of a 63-year-old male. (A) Broad superior RNFL defect with red-free photography. (B) Superior RNFL thinning with OCT RNFL thickness map. (C) 4.5 × 4.5 mm OCT-A superficial slab (defined as inner limiting membrane to posterior inner plexiform layer) shows reduced capillary perfusion corresponding to the RNFL thinning (dashed lines). (D) Inferior arcuate-like defect using the 24–2 visual field test grid corresponding to the structural loss. (Case 15) Retrograde degeneration in a 60-year -old male. (E) Temporal reduction in RNFL reflectivity in the right eye evident from the red-free image. (F) Concordant RNFL thinning with OCT RNFL thickness map. (G) Temporal reduction in capillary perfusion corresponding to location of RNFL thinning with 4.5 × 4.5 mm OCT-A superficial slab (dashed lines). (H) Right vertical central midline field loss with the 30–2 test grid. (Case 16) Ischaemic retinal nerve fibre layer loss in a 53-year-old female. (I) Superotemporal RNFL defect in the right eye evident from the red-free image. (J) Focal superotemporal RNFL thinning not contiguous with the disc on OCT RNFL thickness map. (K) Deep and focal reduction in capillary density in the region of RNFL thinning (dashed lines) using 4.5 × .4.5 mm OCT-A superficial slab. (L) No associated functional loss detected with the 24–2 test grid possibly due to the narrow RNFL loss and the course test grid (test spots are 6 degrees apart and the defect is roughly 3 degrees wide around 10 degrees from the ONH). (Case 17) Leber hereditary optic neuropathy in a 60-year-old male. (M) Temporal reduction in RNFL reflectivity in the right eye evident from the red-free image. (N) Temporal RNFL thinning, more marked inferiorly than superiorly with OCT RNFL thickness map. (O) 4.5 × 4.5 mm OCT-A superficial slab shows marked reduction in capillary perfusion temporally (dashed lines). (P) Superior paracentral defect on the 30–2 test grid. (Case 18) Superior segmental optic nerve hypoplasia in a 40-year-old male. (Q) Marked reduction in RNFL reflectivity in the superior and nasal peripapillary regions in the right eye shown in the red-free image. (R) Superior and nasal RNFL thinning on OCT RNFL thickness map. (S) Marked reduction in capillary perfusion in the regions of RNFL thinning with 4.5 × 4.5 OCT-A superficial slab (dashed lines). (T) Deep inferotemporal visual field defect on the 30–2 test grid. The key visual characteristics for these cases are: Case 14, visual acuity 6/6 R and L: mean deviation (MD) −3 dB L (24–2 test grid) and MD −7 dB (10–2 test grid); Case 15, visual acuity 6/7.5 R and L: MD R −4.4 dB L −5.6 dB (24–2 test grid); Case 16, visual acuity 6/6 R and L: MD R −0.6 dB L −0.3 dB (both 24–2 test grid); Case 17, visual acuity 6/38 R 6/48 L: MD −1.74 dB R and −4.73 L (both 24–2); Case 18, visual acuity 6/6 R and L: MD −8.53 dB R and −11.14 dB L (both 24–2 test grid).