Figures & data
Figure 1. Examples of (A) an OCT fundus image overlaid with a six mm horizontal line scan in a temporal (T) to nasal (N) direction, (B) a B-scan image from the OCT after averaging 128 individual scans from the same location, (C) a B-scan image after correction for tilt and layer segmentation. The software automatically segmented the internal limiting membrane (red), retinal pigment epithelium – choroid interface (green), and choroidoscleral interface (blue) for choroidal thickness (CT) and retinal thickness (RT) measurements.
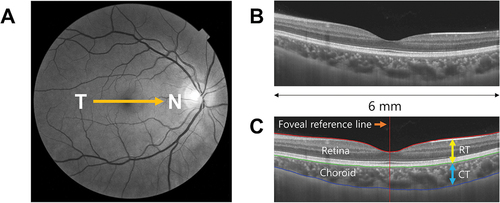
Figure 2. Time course of the changes in (a) eyelid surface temperature (b) choroidal thickness (CT) and (c) macular retinal thickness with a warm stimulus (orange) and a cold stimulus (blue). The yellow-shaded region indicates 10 min of the treatment period; the grey-shaded region indicates 15 min of the recovery period following the removal of the stimuli. *Indicates significantly different changes in choroidal thickness between the eyes. Data are presented as the median in (a) and mean in (b) and (c), and the error bars represent the interquartile range in (a) and ±1 standard errors of the mean in (b) and (c).
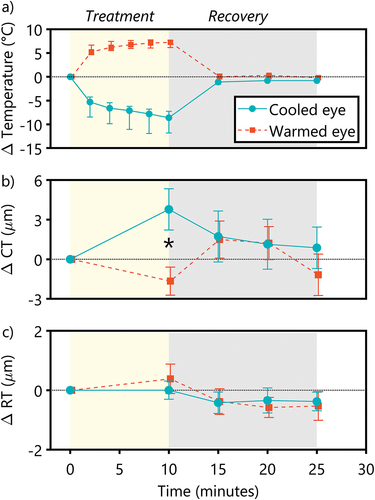
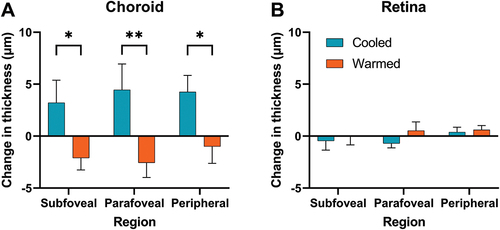
Figure 3. Changes in the thickness of the choroid (A) and retina (B) in the subfoveal, parafoveal, and perifoveal regions after application of the thermal stimuli (cooled eye, blue, warmed eye, orange) for 10 min. Data are presented as mean ± 1 standard error of the mean. *p < .05; **p < .005.