Figures & data
Figure 1. Computed tomography images (coronary view) before vaccine therapy, revealing diffuse peritoneal thickening (⇒) and ascites (→). ∆ indicates a port implanted in the abdominal wall and intraperitoneal tubing
Figure 2. Cytological findings of ascitic cells. ➔ indicates macrophage ► indicates tumor cells. ⇦ are lymphocytes (a) May-Grünwald-Giemsa staining of ascitic cells before immunotherapy. A high number of tumor cells formed clusters. (b) Ascitic cells after four vaccinations. There was a significant decrease in tumor cells and an increase in immune cells. (c) Ascitic cells in December 2018: a small number of tumor cells and immune cells such as lymphocytes and macrophages were observed. (d) Ascitic cells in May 2019: almost all ascitic cells were lymphocytes and macrophages. (e) The number of tumor clusters formed by 10 or more tumor cells was counted under a microscope at x 100 visual field, and the average with standard deviation was calculated by EXCEL. * significant compared to the cluster number before vaccination
Figure 3. Phenotype of mature dendritic cells (DCs). Flow cytometric analysis of DCs matured with tumor necrosis factor α and IFN-α for expression of DC surface markers. We performed single staining for all markers (CD40, CD86, HLA-Class I, HLA-DR, CD14 and CD11 c). DCs were highly positive for co-stimulatory molecule expression. NC: Negative Conrol. DC: Dendritic Cells
Figure 4. Intranodal administration of DC vaccine into unaffected groin lymph nodes (LNs) using direct ultrasound guidance provided by a skilled doctor. Left panel: the groin LNs before vaccine administration. Right panel: the same LNs after vaccine injection, showing swelling of the LNs
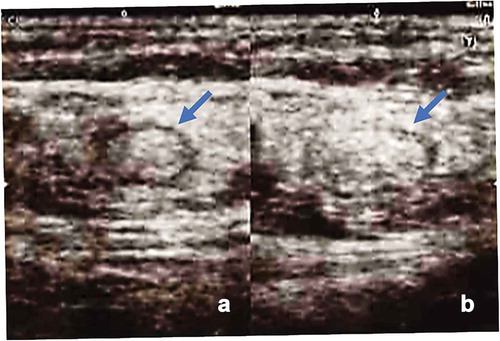
Figure 5. Timeline of CA-125 levels (U/ml) over the treatment course after vaccine therapy. Arrow indicates the vaccine therapy. After four rounds of vaccination, CA-125 levels decreased from 4470 U/ml to 1303 U/ml at the start of vaccine therapy
Table 1. List of non-synonymous SNVs
Table 2. List of predicted neoantigen
Table 3. The expression of the neoantigen candidate epitopes by referring to the RNAseq data
Figure 6. a) Results of epitope-specific IFN-γ-secreting cells detected in ELISPOT assays. Four types of autologous-matured mutant peptide-loaded dendritic cells (5 × 10³ cells/well) were co-incubated with or without the preserved lymphocytes before or after three rounds of vaccination (1.5 × 10⁵ cells/well) for 48 h, and IFN-γ secretion spots were detected with an ELISPOT reader. Data indicate mean of duplicate assays. b) Dose-dependent IFN-γ secretion by lymphocytes incubated with the peptide-loaded DCs. Data show the mean of the triplicate assay. * significant compared to DCs without peptides. Ly; lymphocytes before DC stimulation, mDC; matured dendritic cells
Table 4. PPM1 F mutant peptide-reactive TCRs
Figure 7. Response of CTL clones to PPM1 F mutant and wild-type peptides. CTL clone recognition of PPM1 F mutant and wild-type peptides was determined by IFN-γ ELISA. CTL clones (responders) were co-cultured overnight with IISI cells (stimulators) pulsed with PPM1 F mutant peptide or wild-type peptide. IFN-γ secretion was measured in triplicate. A pair of TCRα and TCRβ identified from CTL clones are shown by TCR ID (a-x, b-x), as listed in
Figure 8. Increase in PPM1 F mutant peptide-reactive TCRs after neoantigen DC vaccination. TCR repertoire analysis of T cells in the malignant ascites of the patient pre- and post-DC vaccination was performed by next-generation sequencing. The frequencies of PPM1 F mutant peptide-reactive TCRα and TCRβ sequences were tracked in TCR repertoire sequencing data obtained from ascites. ND, not detected