
Figures & data
Figure 1. Hierarchical clustering for differentially expressed genes in circulating CD33+HLA-DR+ and CD33+HLA-DR– myeloid cell subsets from healthy donors. Hierarchical clustering of CD33+HLA-DR+ and CD33+HLA-DR– myeloid cells based on differentially expressed genes. Each column represents a sample and each row represents a gene. Expression level of each transcript is depicted according to color scale (a). Principal component analysis (PCA) based on differentially expressed genes in each myeloid subpopulation (b). A Volcano plot shows genes that were upregulated (red), downregulated (green) or remained unchanged (grey) when comparing CD33+HLA-DR+ vs. CD33+HLA-DR– myeloid cell subsets (c). Volcano plot shows differentially expressed genes with a P value cutoff of <0.05 and Log2 fold change >1 and <-1, as indicated by the horizontal line and vertical lines, respectively
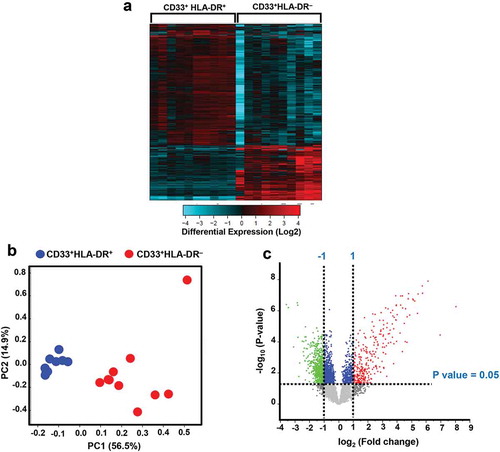
Figure 2. Signaling pathway analyses of myeloid cell subsets. Functional categorization of both upregulated and downregulated genes (with P value <0.05) from CLC analysis were analyzed for CD33+HLA-DR– myeloid cells, compared with CD33+HLA-DR+ APCs using IPA. Heatmaps show the Z-score representing the fold change of each gene in CD33+HLA-DR– myeloid cells, compared to CD33+HLA-DR+ APCs from 10 healthy donors. Functional gene annotations showed that genes related to several cellular processes and signaling pathways were differentially expressed in both myeloid cell subsets (a-d). Functional categorization of top significantly affected transcripts (with P value <0.05) from CLC analysis were analyzed through IPA. The horizontal bars denote the different pathways based on the Z-scores (e).
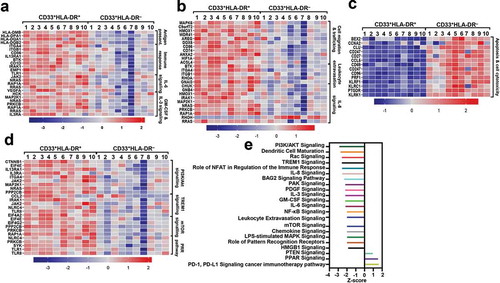
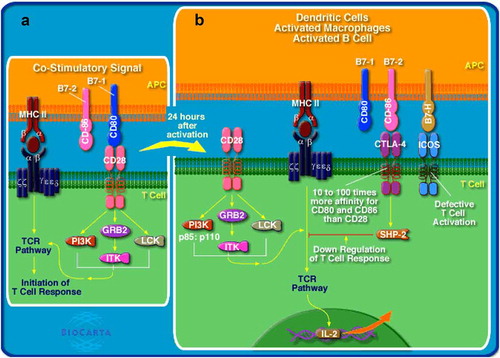
Figure 3. Antigen presentation/processing and T cell activation pathways. APCs with MHC class II-bound antigen bind to T cell receptor (TCR) on T cells and co-stimulatory molecule CD28 (on T cells) binds to CD80 (on APCs), resulting in T cell activation (a). Antigen presentation/processing and T cell activation pathways were downregulated in circulating CD33+HLA-DR– cells. Following activation, T cell response is regulated, perhaps by a negative-feedback mechanism to prevent the development of autoimmunity and shutdown unnecessary activation of T cells. CTLA-4 and ICOS on activated T cells binds to CD86 and B7-H on activated APCs, respectively, resulting in the inhibition of T cell activation (b). Figure obtained from BioCarta/DAVID functional annotation analyses
Supplemental Material
Download PDF (562.6 KB)Data availability statement
The datasets used and/or analyzed in this study are available from the corresponding author upon request.