Figures & data
Table 1. Characteristics of OAPS and healthy control
Figure 1. Comparisons of frequencies of frequencies of CD3-CD16+ CD56dim, CD3- CD16-CD56 bright NK cells and CD3+ CD56 + T cells in patients with OAPS and healthy control women. (a) Flow cytometry plots showing gating strategies of CD3-CD16+ CD56dim, CD3-CD16-CD56 bright NK cells and CD3+ CD56 + T cells from lymphocytes in a representative subject. (b) Frequencies of different CD3-CD16+ CD56dim, CD3-CD16-CD56 bright NK and CD3+ CD56 + T lymphocyte subsets in OAPS patients and healthy control subjects.
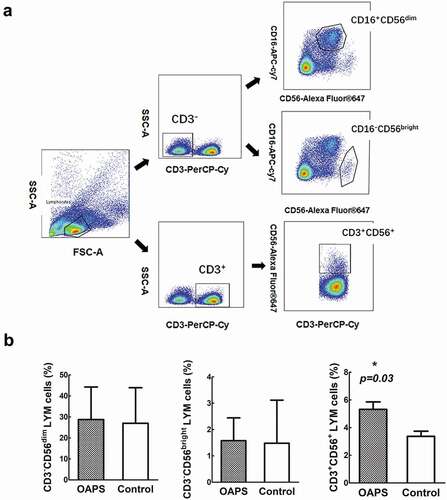
Table 2. The diagnostic efficacy of NKG2A/NKG2D and CD27/CD11b in CD3−CD56dim NK cells in OAPS
Figure 2. Comparisons of frequencies of NKG2A and NKG2D expression in in OAPS patients and healthy control women. (a)Representative flow plots showed the portions of NKG2A and NKG2D expression from CD3- CD16+ CD56dim, CD3- CD16-CD56 bright NK cells and CD3+ CD56 + T cells. Bar charts show the frequencies of different NKG2D and NKG2A subsets in (b) CD3- CD16+ CD56dim NK cells, (c) CD3-CD16-CD56bright NK cells and (d) CD56 + T cells in OAPS patients and healthy control women. (e) ROC curve showing diagnostic accuracy of NKG2A-NKG2D+ subset in CD3-CD16+ CD56dim NK cells to distinguish patients with OAPS. (f) The correlations between NKG2A-NKG2D+ expression and the common logarithms of the concentration of antiphospholipid antibodies. (g) The correlations between NKG2A-NKG2D+ expression and the concentration of the complement C3 and C4. The red underline indicates p < .05. Data were showing as mean ± SD. All P values were two-tailed and considered significant when less than 0.05. *P < .05, **P < .01, ***P < .001.
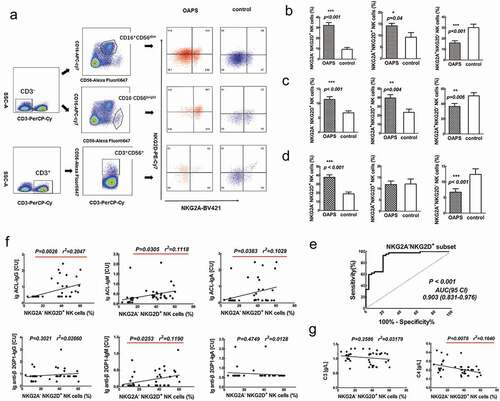
Figure 3. The NKG2A-NKG2D+subset (A) and CD27-CD11b-(B) in CD3-CD16+ CD56dim subset in triple positivity, double positivity and single positivity in OAPS patients. Results are expressed as mean ± SD. *P < .05, **P < .01, ***P < .001.
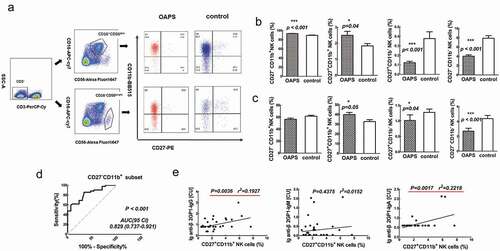
Figure 4. Comparisons of frequencies of CD27 and CD11b expression in in OAPS patients and healthy control women. (a) Representative flow plots showed the portions of CD27and CD11b expression from CD3- CD16+ CD56dim and CD3-CD16-CD56 bright NK cells. Bar charts show the frequencies of different CD27and CD11b subsets in (b) CD3-CD16+ CD56dim NK cells, (c) CD3- CD16-CD56 bright NK cells and in OAPS patients and healthy control women. (d) ROC curve showing diagnostic accuracy of CD27-CD11b+ subset in CD3-CD16+ CD56dim NK cells to distinguish patients with OAPS. (e)The correlations between the change in the percentage of CD27+ CD11b+ in CD3- CD16+ CD56dim NK cells and the common logarithms of antiphospholipid antibodies. The red underline indicates p < .05.Data were showing as mean ± SD. All P values were two-tailed and considered significant when less than 0.05. *P < .05, **P < .01, ***P < .001.