
Figures & data
Table 1. Antibodies for flow cytometry
Table 2. Primer sequences
Figure 1. ELF3 expression in IL-17A-expressing CD4+T cells. (a) Flow cytometry gating strategy for IL-17A-expressing CD4+ T cells in DSS-induced colitis model. SP: spleen. mLN: mesenteric lymph nodes. LP: lamina propria. (b) ELF3 mRNA levels in IL-17A-expressing CD4+ T cells sorted from spleens, mesenteric lymph nodes, and lamina propria of DSS-treated mice. A: A549 cell line. Un: under detection limit. N = 5 mice per group. ***: P <0.001 compared with A549 cell line. Student’s t-test. (c) Immunoblotting image showing ELF3 protein in sorted IL-17A-expressing CD4+ T cells. Note that the “SP” group represents splenic CD4+ T cells due to the low number of splenic IL-17A-expressing CD4+ T cells. The images represent 2 independent experiments. (d) Fluorescent staining of ELF3 in sorted LP or mLN IL-17A-expressing CD4+ T cells.
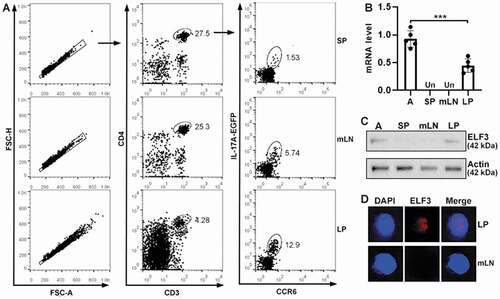
Figure 2. ELF3 expression in Th17 cells and Th17.1 cells. (a) Flow cytometry dot plots showing CXCR3 expression on the surface of CD4+IL-17a+ccr6+ T cells in mLns and LP. (b) Frequencies of subset I (CXCR3-) and subset II (Cxcr3+) in CD4+IL-17a+ccr6+ T cells. (c to g) mRNA levels of indicated molecules in subset I and subset II. (h) IL-17A-EGFP intensities of LP subset I and subset II. Left panel: flow cytometry histograms. Right panel: statistics. (i) IFN-γ expression in LP subset I and subset II after stimulation with PMA/ionomycin. Left panel: flow cytometry contour plots. Right panel: statistics. (j) mRNA levels of ELF3 in LP subset I and subset II. N = 5 mice per group. *: P <.05; **: P <.01; ***: P <.001. One-way ANOVA for B to G. Student’s t-test for H to J.
Figure 3. Effect of ELF3 overexpression on Th17 cell generation in vitro. (a) GFP expression in wild-type splenic CD4+ T cells after in vitro Th17 polarization and lentiviral infection. Blank: infection medium only. LC: infection with control lentivirus without ELF3-encoding sequence. LE: infection with ELF3-encoding lentivirus. The images represent 2 independent experiments. (b) ELF3 protein in splenic CD4+ T cells after in vitro Th17 polarization and lentiviral infection. The images represent 2 independent experiments. (c) Splenic CD4+ T cell apoptosis after Th17 polarization and lentiviral infection. Left panel: representative flow cytometry dot plots. Right panel: statistics of Annexin V+ apoptotic cells. (d) Ki67 staining in splenic CD4+ T cells after Th17 polarization and lentiviral infection. Left panel: representative flow cytometry histograms. Right panel: statistics of Ki67+ cells. (e and f) Expression of IL-17A (e) and IFN-γ (f) in splenic CD4+ T cells after Th17 polarization and lentiviral infection. Left panels: representative flow cytometry dot plots. Right panel: statistics of IL-17a+ and IFN-γ+ cells. N = 3 (T cells from 3 mice) per group. Student’s t-test.
Figure 4. Effect of ELF3 overexpression on Th17.1 cell generation in vitro. (a and b) Flow cytometry dot plots showing the expression of IL-17A (a) and IFN-γ (b) in splenic CD4+ T cells after Th17.1 polarization and lentiviral infection. LC: infection with control lentivirus without ELF3-encoding sequence. LE: infection with ELF3-encoding lentivirus. (c) Frequencies of IL-17a+ and IFN-γ+ cells after Th17.1 polarization and lentiviral infection. N = 6 (T cells from 6 mice) per group. (d) Flow cytometry histograms showing the expression of RORγt and T-bet in splenic CD4+ T cells after Th17.1 polarization and lentiviral infection. (e) Mean fluorescence intensities of RORγt and T-bet in splenic CD4+ T cells. N = 3 (T cells from 3 mice) per group. (f) Flow cytometry histograms showing the phosphorylation of STAT3 and STAT1 in splenic CD4+ T cells after Th17.1 polarization and lentiviral infection. (g) Mean fluorescence intensities of phosphorylated STAT3 and STAT1. N = 3 (T cells from 3 mice) per group. *: P <.05; **: P <.01; ***: P <.001. Student’s t-test.
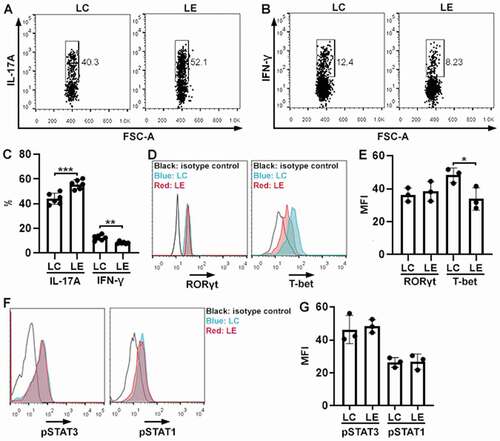
Figure 5. Effect of ELF3 overexpression on Th17.1 cell function in vivo. (a) Flow cytometry dot plots showing exogenous GFP+ T cells in the LP of Rag1−/− mice four weeks after transfer. LC: control Th17.1 cells without ELF3 expression. LE: ELF3-overexpressing Th17.1 cells. (b) ELF3 mRNA levels in cultured Th17.1 cells (in vitro) or Th17.1 cells sorted from the recipients’ LP (in vivo). Un: under detection limit. (c) Flow cytometry histograms showing Ki67 staining in exogenous LP Th17.1 cells. (d) Statistics of Ki67+ cells in (c). (e and f) Flow cytometry dot plots showing the expression of IL-17A (e) and IFN-γ (f) in exogenous Th17.1 cells after sorting from LP and stimulation with PMA/ionomycin. (g) Statistics of the frequencies of IL-17a+ and IFN-γ+ cells in exogenous Th17.1 cells. (h) mRNA levels of IL-22 and TNF-α in exogenous Th17.1 cells. N = 3–6 mice per group. **: P <.01; ***: P <.001. Student’s t-test.
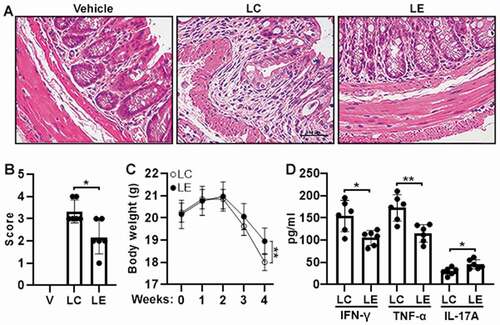
Figure 6. Severity of adoptive transfer-induced colitis. (a) H&E staining of colons four weeks after adoptive transfer of Th17.1 cells. Vehicle: Rag1−/− mice transferred with PBS. LC: Rag1−/− mice transferred with control Th17.1 cells. LE: Rag1−/− mice transferred with ELF3-overexpressing Th17.1 cells. (b) Histological scores. (c) Mouse body weight. (d) Concentrations of indicated cytokines in colon tissues. N = 6–8 mice per group. *: P <.05; **: P <.01. Student’s t-test.
Supplemental Material
Download PDF (290 KB)Data availability statement
The data are available from the correspondence author upon reasonable request.