Figures & data
Figure 1. Overview of BCR repertoire characterization and features of COVID-19 cohorts. (a) Schematic diagram of overall study design. (b) Laboratory characteristics differences between the mild and moderate COVID-19 cohorts. The total number of leukocytes, neutrophil granulocytes, lymphocytes, CD3+, CD4+, and CD8+ T cells in the blood, the ratio of CD4+:CD8+T cells, and immunoglobulin (Ig) levels including IgA, IgM and IgG in recovered COVID-19 patients with the mild or moderate symptom. The Wilcoxon rank-sum test was used to determine the statistical significance of the characteristics.
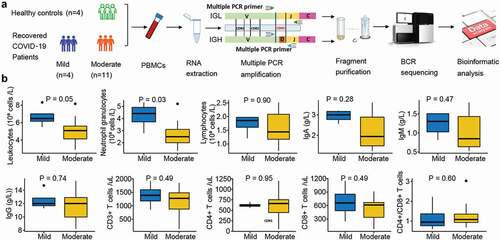
Table 1. Basic information of cohorts in this study.
Figure 2. Diversity of the heavy and light chains of BCR repertoire in COVID-19 patients. (a) Violin plot of Shannon Wiener-Index representing the clonal diversity of the heavy chain in healthy individuals, mild and moderate COVID-19 patients. The Wilcoxon rank-sum test was used to determine statistical significance. (b) Venn diagram of expressed clonotypes of the heavy chain in healthy controls (HC) and mild patients (Mild). (c) the frequency distribution of the length of the heavy chain CDR3 region. The Kruskal-Wallis test was used to determine the statistical significance of the average length distribution across different cohorts. (d) Violin plot of Shannon Wiener Index representing the clonal diversity of the light chain. (e) Venn diagram of expressed clonotypes of the light chain in HC and Mild groups. (f) the frequency distribution of the length of the light chain CDR3 region.
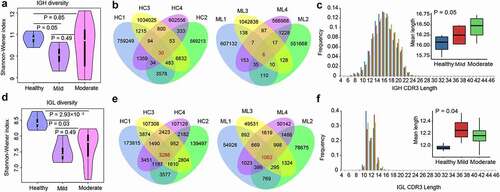
Figure 3. V and J gene usage of the heavy and light chains of BCR repertoire among healthy controls, mild and moderate COVID-19 patients. (a) Frequency distribution of overall IGHV-gene usage. (b) Heatmap of IGHV genes with significant differences (P < .05) between healthy individuals and COVID-19 patients. The Kruskal-Wallis test was used to determine statistical significance. (c) Frequency distribution of IGHJ-gene usage (d) Frequency distribution of IGLV-gene usage. (e) Heatmap of IGLV genes with significant differences (P < 0.05) between healthy individuals and COVID-19 patients. (f) Frequency distribution of IGLJ-gene usage. (g) Heatmap of IGLJ genes with significant differences (P < 0.05) between healthy individuals and COVID-19 patients. The gene name in red denotes up-regulated genes in the top 20 abundant gene types in COVID-19 patients.
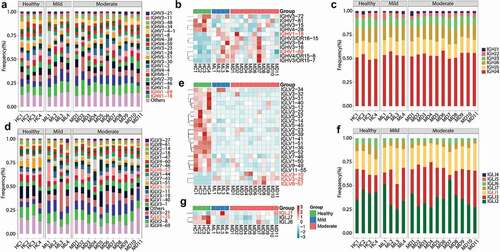
Figure 4. Features of expanded clones of B-cell immune repertoires in COVID-19 patients. (a) Comparison of IGH and (b) IGL clonal expansion among the healthy, mild and moderate in low (clones with count between 2 and 10)and high expanded (clones with count ≥ 11) types. The Wilcoxon rank-sum test was used to determine the statistical significance of the frequency across different groups. (b) B cell repertoire-wide phylogenetic tree analysis in the healthy, mild, and moderate. The top 20 clones from each IGL repertoire were analyzed.
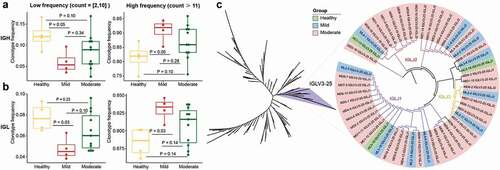
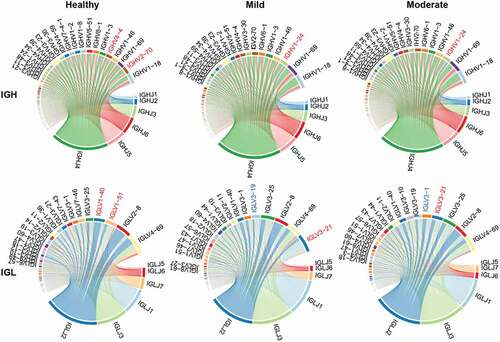
Figure 5. Circos plot of V-J pairs of IGH and IGL in the healthy, mild, and moderate. The red gene symbol denotes the unique top five abundant genes among healthy controls or COVID-19 patients.