Figures & data
Table 1. Gynecological and demographic data of the participated women.
Figure 1. Gating strategy for flow cytometry analysis. Selection method of the investigated peripheral CD8+ and CD8- NKT immune cell subpopulations.
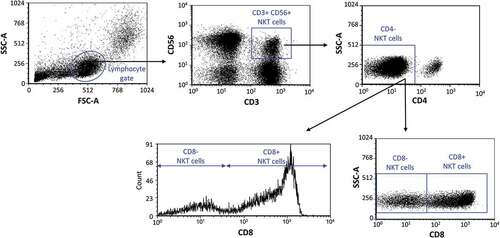
Figure 2. Percentage of the CD8 receptor positive and CD8 receptor negative NKT cells in all lymphocytes (a) and in the NKT subpopulation (b) in the three trimester of healthy pregnancy and in healthy controls. The solid bars represent medians of 35, 34, 30 and 36 determinations respectively, the boxes indicate the interquartile ranges, and the whiskers show the most extreme observations. The middle square within the box represents the mean value. Statistically significant differences with p-values <0.01*** and <0.03** are indicated.
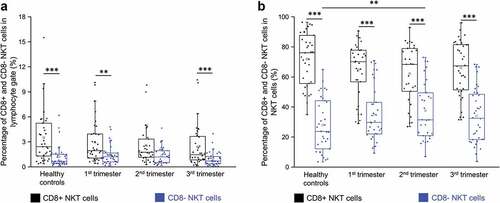
Figure 3. PD-1 receptor expression (a) and PD-L1 ligand expression (b) by CD8 receptor positive and CD8 receptor negative NKT cells in the three trimester of healthy pregnancy and in healthy controls. The solid bars represent medians of 15, 13, 10 and 18 determinations respectively, the boxes indicate the interquartile ranges, and the whiskers show the most extreme observations. The middle square within the box represents the mean value. Statistically significant differences with p-values <0.01***are indicated. Representative FACS plots and histograms show the expression of PD-1 surface marker (c) and PD-L1 surface molecule (d) by cells in the lymphocyte gate. To determine the positivity of PD-1 and PD-L1 fluorescent minus one (FMO) control was used.
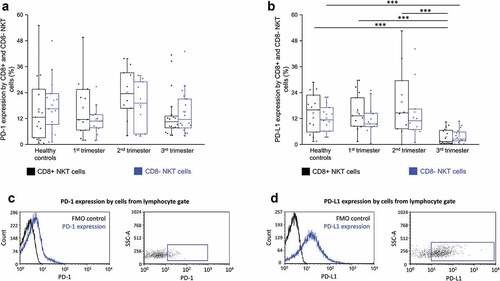
Figure 4. TIGIT receptor expression (a) and CD226 receptor expression (b) by CD8 receptor positive and CD8 receptor negative NKT cells in the three trimester of healthy pregnancy and in healthy controls. The solid bars represent medians of 18, 20, 19 and 16 determinations respectively, the boxes indicate the interquartile ranges, and the whiskers show the most extreme observations. The middle square within the box represents the mean value. Statistically significant differences with p-values and <0.03**, <0.05* are indicated. Representative FACS plots and histograms show the expression of TIGIT surface marker (c) and CD226 surface molecule (d) expression by cells in the lymphocyte gate. To determine the positivity of TIGIT and CD226 FMO control was used.
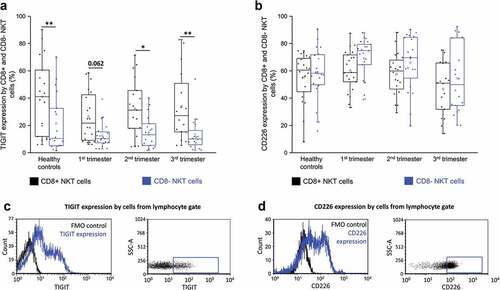
Figure 5. CD112 expression (a) and CD155 receptor expression (b) by CD8 receptor positive and CD8 receptor negative NKT cells in the three trimester of healthy pregnancy and healthy controls. The solid bars represent medians of 19, 20, 19 and 17 determinations respectively, the boxes indicate the interquartile ranges, and the whiskers show the most extreme observations. The middle square within the box represents the mean value. Statistically significant differences with p-values <0.01*** are indicated. Representative FACS plots and histograms show the expression of CD112 surface marker (c) and CD155 surface molecule (d) expression by cells in the lymphocyte gate. To determine the positivity of CD112 and CD155 FMO control was used.
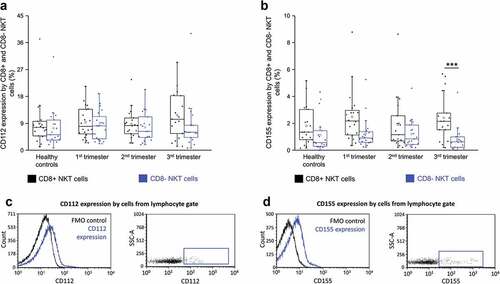
Figure 6. The ratio of the CD226/TIGIT mean fluorescent intensity value on CD8 receptor positive and CD8 receptor negative NKT cells in the three trimester of healthy pregnancy and in healthy controls (a). The solid bars represent medians of 20, 19, 16 and 15 determinations respectively, the boxes indicate the interquartile ranges, and the whiskers show the most extreme observations. The middle square within the box represents the mean value. Statistically significant differences with p-values <0.03** and <0.05* are indicated. Linear regression results presenting the relationship between the relative TIGIT and CD226 expression of CD8 cells among the three trimester of pregnancy and healthy control group (b). Coefficients of determination (r2) are presented on each figure.
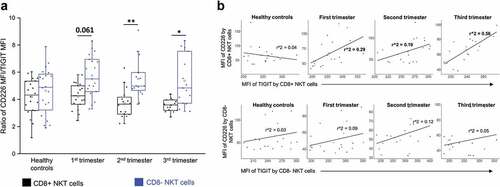
Figure 7. NKG2D expression (a) by CD8 receptor positive and CD8 receptor negative NKT cells in the three trimester of healthy pregnancy and in healthy controls. The solid bars represent medians of 33, 34, 30 and 36 determinations respectively, the boxes indicate the interquartile ranges, and the whiskers show the most extreme observations. The middle square within the box represents the mean value. Representative FACS plots and histograms show the expression of NKG2D surface marker (b) expression by cells in the lymphocyte gate. To determine the positivity of NKG2D FMO control was used.
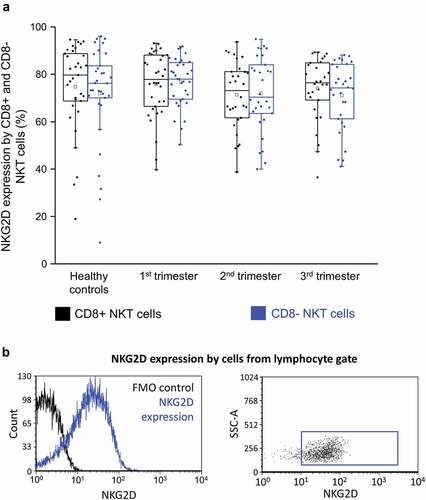
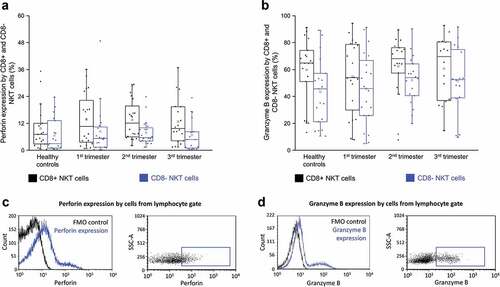
Figure 8. Intracellular perforin expression (a) and granzyme B receptor expression (b) by CD8 receptor positive and CD8 receptor negative NKT cells in the three trimester of healthy pregnancy and in healthy controls. The solid bars represent medians of 20, 21, 21 and 18 determinations respectively, the boxes indicate the interquartile ranges, and the whiskers show the most extreme observations. The middle square within the box represents the mean value. Representative FACS plots and histograms show the expression of perforin surface marker (c) and granzyme B intracellular molecule (d) expression by cells in the lymphocyte gate. To determine the positivity of perforin and granzyme B FMO control was used.