
Figures & data
Table 1. Comparison of models developed to simulate perlite expansion and furnace conditions.
Figure 1. Photo of the Vertical electric furnace used for microspheres production (a), and schematic with furnace peripheral (b).
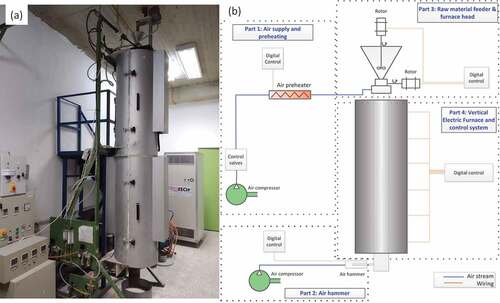
Figure 2. Sketch of the VEF open view (a), and modelled geometry with boundaries conditions (b).
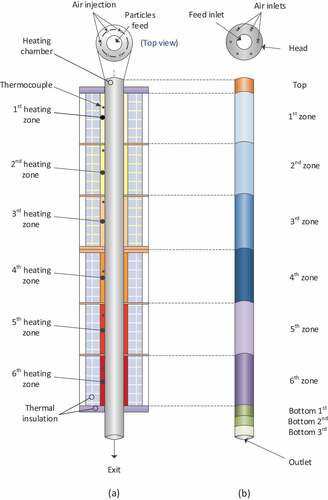
Figure 3. Thermal image of the bottom part of the furnace showing intensive temperature gradation.
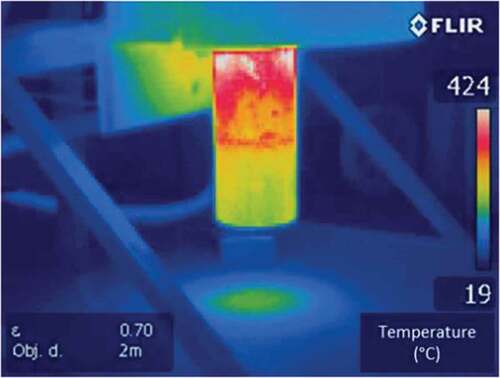
Figure 4. Particle expansion model.
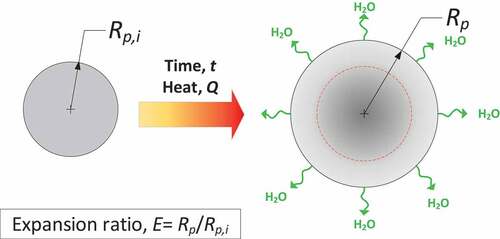
Figure 5. Top-side view of meshing at the furnace head and the 1st zone (a), and at the bottom of the furnace (b). Blue ellipse encloses the layer of fine wedges applied nearby and along the furnace walls, and the yellow one depicts enhancement of mesh fineness at the proximity of boundaries.
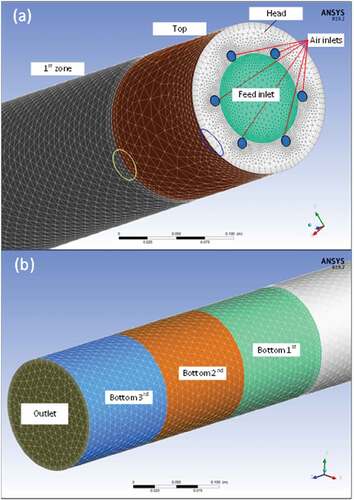
Table 2. Boundaries’ types and range of setting values.
Figure 6. Solution strategy in two-way coupling scheme.
Figure 7. Axial velocity of air along the furnace centerline for different mesh thickness (Tw=1000°C, Qair,in=50 L/min).
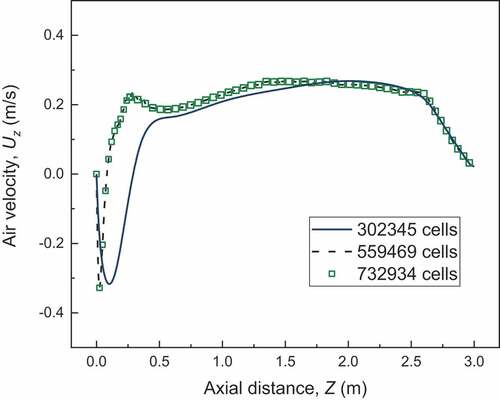
Table 3. Chemical composition of mineral fed.
Figure 8. Mass loss (a) and derivative of mass loss (b) versus temperature of perlite particles (−125+90 μm) under four different heating rates, and Friedman plot (c) and the calculated activation energy of perlite decomposition versus conversion degree (d).
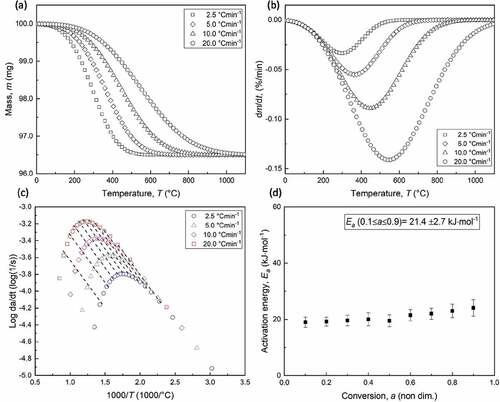
Figure 9. Microspheres’ expansion ratios calculated by particle swelling model for different temperatures.
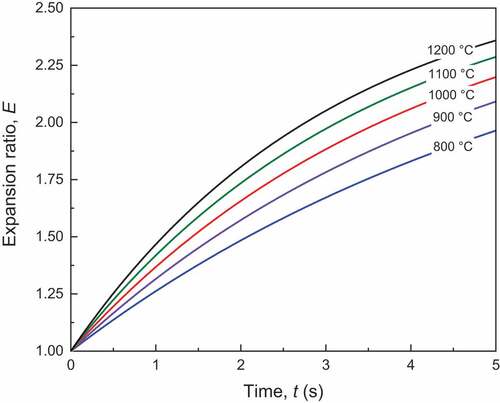
Figure 10. Particle tracks coloured by density (left), temperature (middle) and velocity (right) for different feed size (150, 250, and 350 μm) and under isothermal and gradient mode of operation of the furnace.
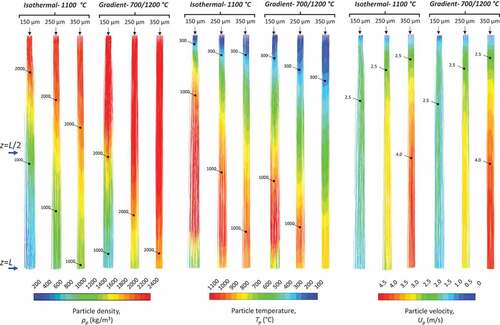
Figure 11. Temporal evolution of mass-weighted averaged values of critical particle state variables for different feed size (150, 250 and 350 μm) treated under isothermal (Tw=1100°C, Qair,in=50 L/min) and gradient (Tw,1=700°C, Tw,6= 1200°C, step 100°C, Qair,in=50 L/min); temperature (a), water content (b), density (c) and velocity (d).
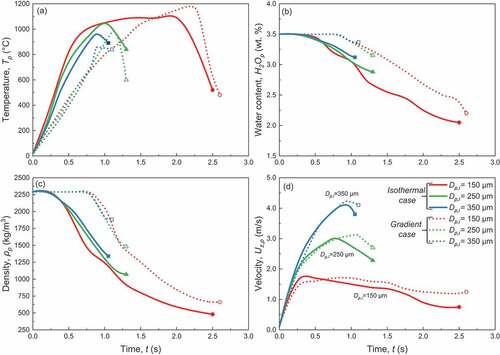
Figure 12. Mean, minimum and maximum density of perlite microspheres obtained by treatment of monodispersed raw material of 150 μm, 250 μm, and 350 μm size for different furnace wall temperature (a,b), air feeding rate (c,d) and feed air temperature (e,f), and under isothermal (a,c,e), and gradient mode (b,d,f) of operation of the furnace.
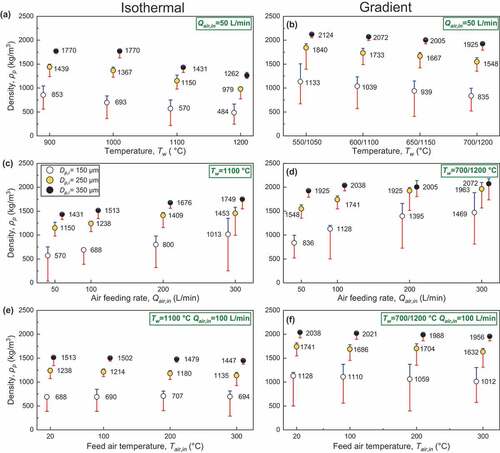
Figure 13. Size distribution of feed and products obtained by the treatment of narrow (a) and wide (b) granulometry of the feed and Rossin-Rammler parameters of feed and products (size constant, n: distribution parameter), and density obtained by grains of different size in the case of narrow (c) and wide (d) size distribution of the feed.
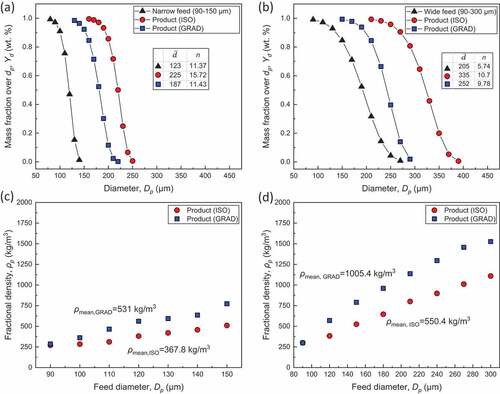
Figure 14. Particle tracks coloured by density for narrow and wide size distribution of the feed, treated under isothermal and gradient operating mode of the furnace.
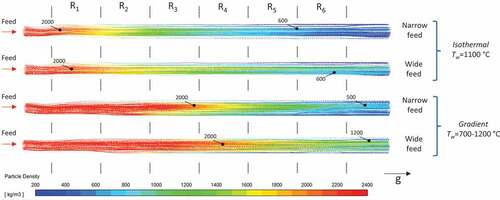
Figure 15. Contours of air temperature (left) and particles’ concentration (centre) at the midplane of the furnace under different air feeding conditions, and particle tracks coloured by density (right) [Other parameters: Tw= 1100°C, Dp,i 75 μm and Qp,in=4 kg/h].
![Figure 15. Contours of air temperature (left) and particles’ concentration (centre) at the midplane of the furnace under different air feeding conditions, and particle tracks coloured by density (right) [Other parameters: Tw= 1100°C, Dp,i 75 μm and Qp,in=4 kg/h].](/cms/asset/1bce84b9-a127-4ec9-a68a-a1eba2dc86b4/gmpr_a_2161536_f0015_oc.jpg)
Figure 16. Mass weighted average of particles’ density at two cross sections of the chamber located at the middle distance between the furnace head and the exit (z=l/2) and at the furnace exit (z=l), under different air feeding conditions. Processing condition are identical to those applied in samples of .
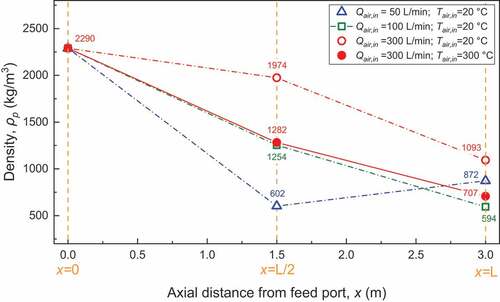
Figure 17. Spatial evolution of particles’ temperature along their trajectories for different air feeding conditions.
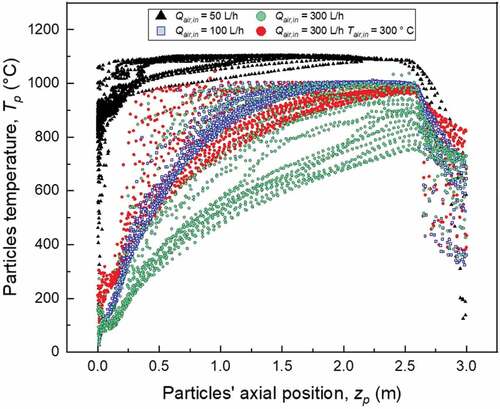
Figure 18. Diagrams with comparison of experimental measurements and simulation results; (a) calculated and measured values of air velocity and temperature at the exit of the chamber under different air feeding rate and constant furnace wall temperature (Tw=1000°C), and (b) comparison of calculated and experimentally measured expansion ratio of perlite particles expanded under various furnace wall temperature.
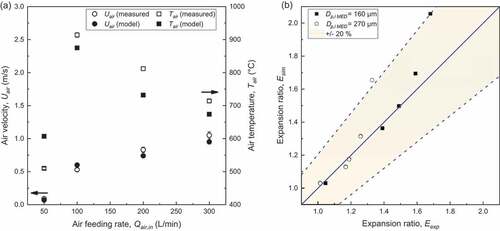
Table 4. Comparison of measured values of air temperature and air velocity at the exit of the chamber, and respective values calculated by the model, and absolute error.
Table 5. Measured and calculated density and expansion ratio values for microsphere samples obtained by the treatment of feed with size of 150 and 250 μm treated under isothermal mode of operation of the furnace and for different furnace wall temperature.