Figures & data
FIGURE 1 A conventional hybrid model.
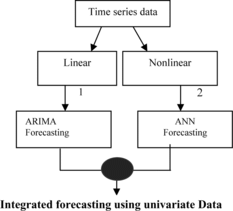
FIGURE 2 A proposed hybrid model.
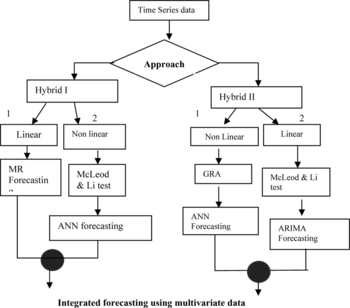
TABLE 1 Similarities and Differences Between a Conventional Model and a Proposed Hybrid Model
TABLE 2 Grain Crop Yield and Its Affecting Factors
TABLE 3 Fraction of Daily KLSE Closing Price with 14 Affecting Factors
FIGURE 3 Basic steps in GRA.
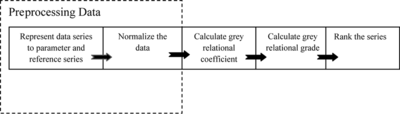
FIGURE 4 Best input feature selected by GRA.
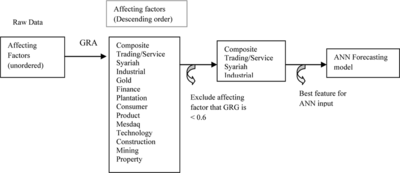
TABLE 4 Affecting Factors for Grain Crop Yield Selected by GRA
TABLE 5 Affecting Factors for KLSE Close Price Selected by GRA
TABLE 6 Eight Steps in Developing ANN Model
TABLE 7 GRANN Structure
TABLE 8 Statistical Test for Grain Crop and KLSE Close Price
TABLE 9 Forecasting Values of GRANN Versus MR
FIGURE 5 Forecasting values for each model (crop yield).
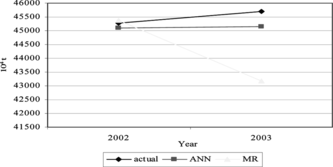
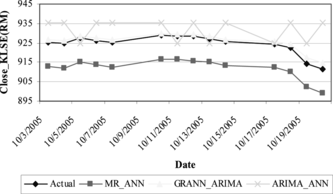
FIGURE 6 Forecasting values for each model (KLSE close price).
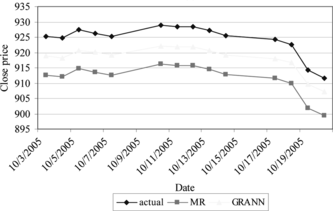
TABLE 10 Results for the Hybrid I Model
TABLE 11 Results for the Proposed Hybrid II
TABLE 12 Comparison Performance of Hybrid I, Hybrid II, and the Conventional Hybrid Model
FIGURE 7 Comparison of Hybrid I and Hybrid II (crop yield).
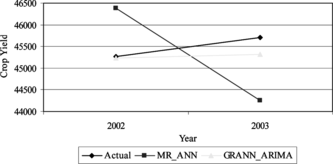
FIGURE 8 Comparison of Hybrid I and Hybrid II (KLSE close price).