Figures & data
FIGURE 1 The multi-layer RL framework contains both the Profiler model and RL in each level. The Profiler using a naive Bayesian model identifies the player type and then provides an appropriate reward function which becomes an input of RL in the top level. RL at the top level learns a general strategy that triggers one of the low level RLs for learning more specific actions.
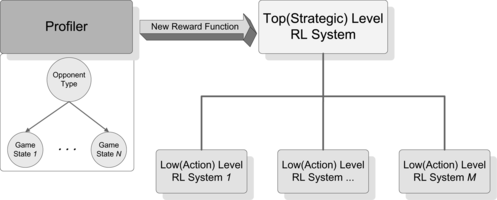
FIGURE 2 The SARSA calculates the Q-value for each nonterminal state where α is the step-size parameter and γ the reward discount factor.
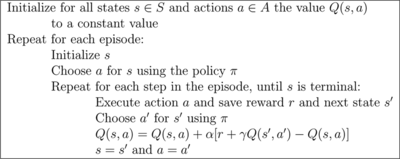
FIGURE 3 The Q-learning updates the Q-value whenever action a is executed in state s leading to new state s′.
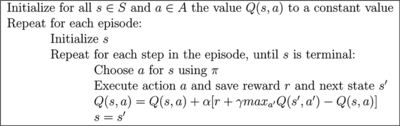
FIGURE 4 The main frame shows units’ composition and locations of the blue army in a small area of battlefield where one enemy unit from the red army is intruding on the border of the fog of war. The bottom-left corner records the unit statistic in both armies and the bottom-right corner presents a mini-map. The mini-map zooms out the whole battlefield and exhibits the location of the currently explored area(with the red rectangular frame). Users can zoom in any area in the mini-map.
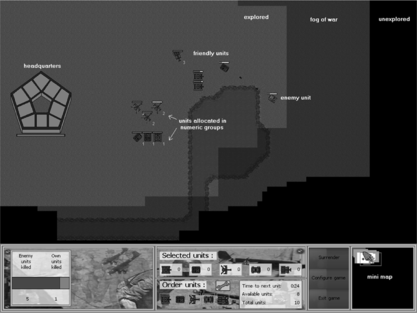
FIGURE 5 The achievement screen summarizes various information and statistics when the game is ended. The middle frame shows the power distribution of both armies when the game is moving on. The bottom displays a time-line on which major battles are plotted as a symbol of two crossed swords. A small headquarter symbol indicates being attacked while being destroyed if there is a mushroom cloud on the top. A small symbol of a blue (or red) war factory shows the captured factory at the time.
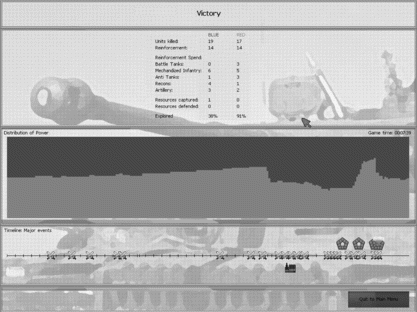
FIGURE 6 The multi-layer RL framework is provided in the Tank General game.
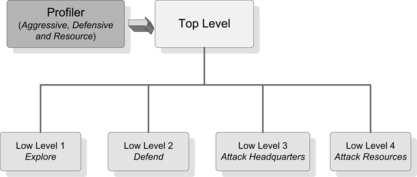
FIGURE 7 The Q-learning performs slightly better than the SARSA where the computer player using the multi-layer RL framework competes with a scripted player of three types.
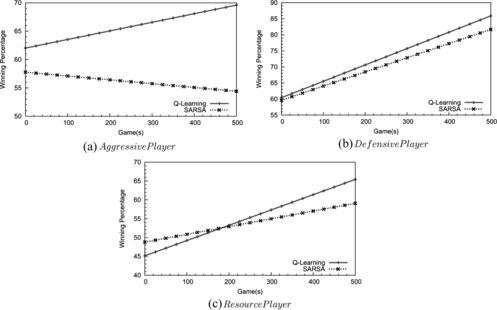
FIGURE 8 Comparison of game time when the player using the multi-layer RL framework plays against either the Aggressive or the Resource player.
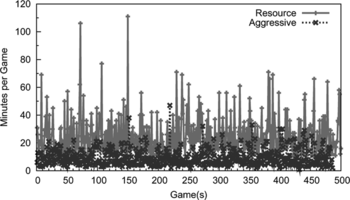
FIGURE 9 The Profiler model improves RL performance in the multi-layer RL framework. Notice that the Profiler shows the benefit of modeling opponents.
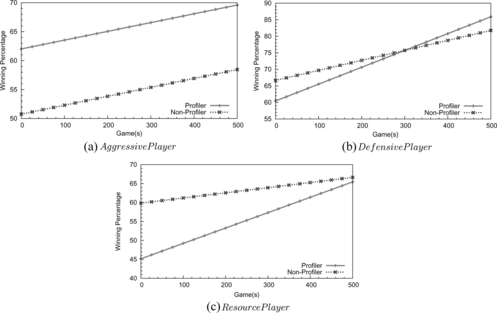
FIGURE 10 Some states are visited frequently while other states are never visited.
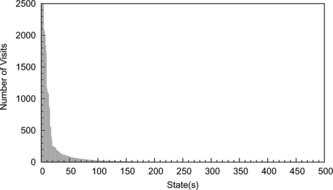
FIGURE 11 The multi-layer RL framework achieves better performance than the single-layer one when both of them are used to compete against the scripted players.
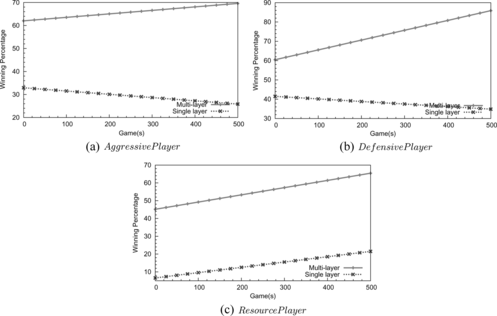
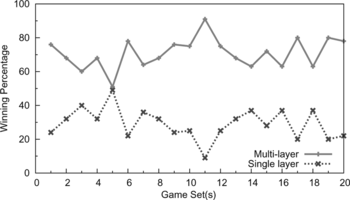
FIGURE 12 A direct war between the multi-layer RL framework and the single-layer RL. The player using the multi-layer RL framework wins most games.