Figures & data
FIGURE 1 Scenario and behavior example—five agents.
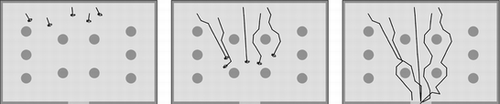
FIGURE 2 Agent perception sectors.
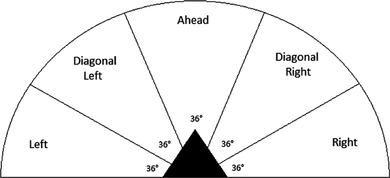
TABLE 1 Mean Number of Collisions Per Run - Rows Represent the Number of Agents
FIGURE 3 Development of the number of collisions for an exemplary run with five agents.
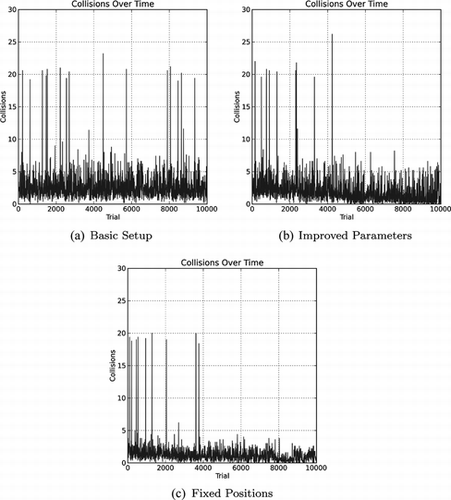
FIGURE 4 Exemplary trajectories during exploit trials, for two agents.
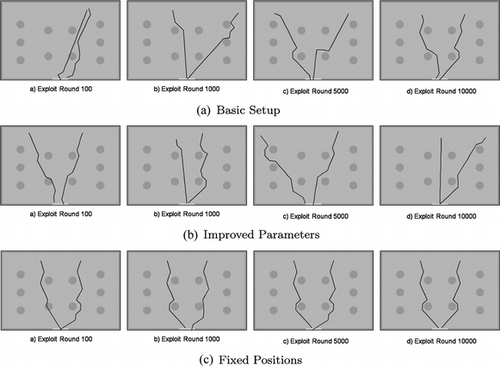
FIGURE 5 Q-learning value distribution for an exemplary agent from a simulation with one agent.
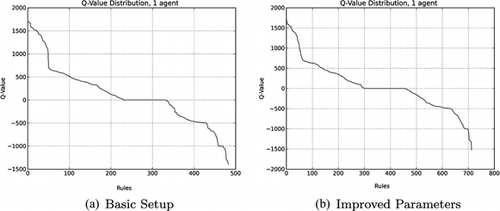
FIGURE 6 Q-learning value distribution for an exemplary agent from a simulation with five agents.
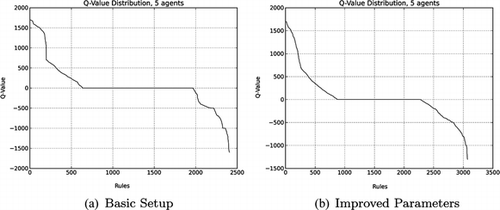
FIGURE 7 Situation-action pairs experience distribution for an exemplary agent from a simulation with five agents.
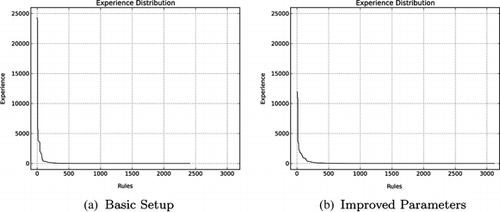
FIGURE 8 Situation-action pairs distribution over the actions for an exemplary agent from a simulation with five agents.
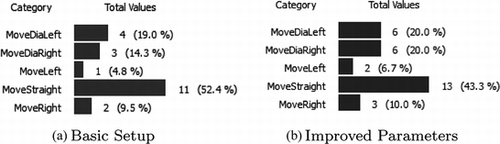
TABLE 2 Classification Accuracy with C4.5 Decision Tree Algorithm, all Models
FIGURE 9 Confusion matrix for the decision tree in the simulation with five agents, basic model. Rows represent the expected class (action) and columns represent the classification determined by the decision tree.
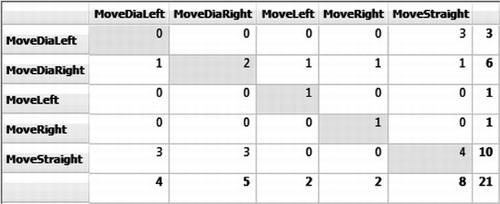
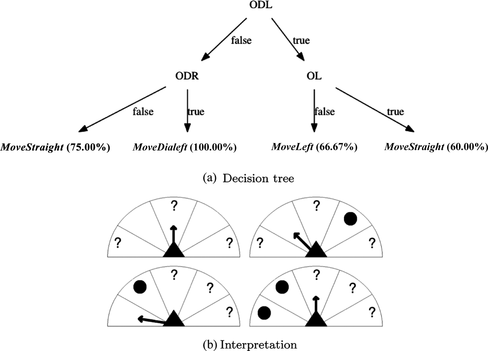
FIGURE 10 Decision tree generated for an exemplary agent of the 5-agents case, basic model.
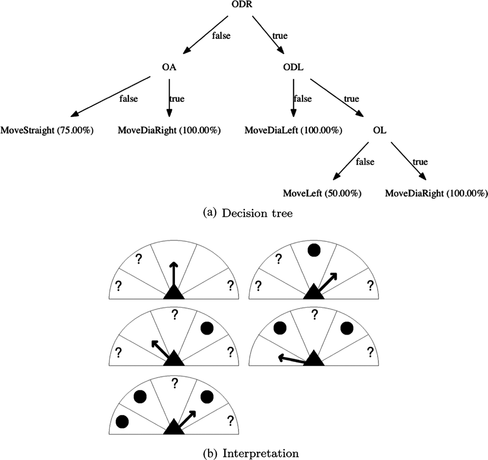
FIGURE 11 Decision tree generated for an exemplary agent of the 5-agents case, improved parameters model.
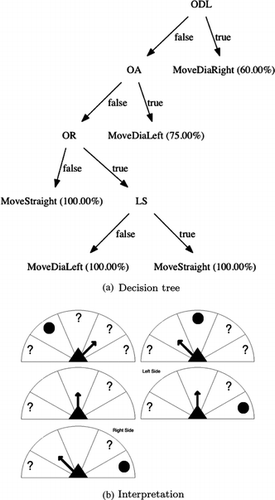
FIGURE 12 Decision tree generated for an exemplary agent of the 5-agents case, fixed initial positions model.