569
Views
45
CrossRef citations to date
0
Altmetric
Articles

Rough Set Methods for Attribute Clustering and Selection

&

Figures & data

TABLE 1 An Exemplary Decision Table with a Binary Decision

FIGURE 1 An attribute-clustering tree for the decision table from , obtained by applying the agglomerative nesting algorithm in combination with the direct discernibility dissimilarity function.

FIGURE 1 An attribute-clustering tree for the decision table from Table 1, obtained by applying the agglomerative nesting algorithm in combination with the direct discernibility dissimilarity function.

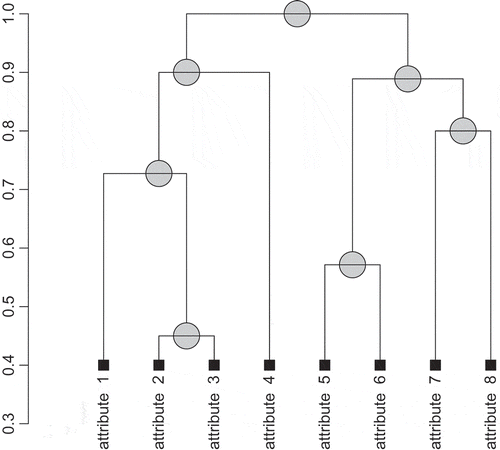
TABLE 2 Average Computation Times of 100 Reducts for Permutations Produced Using Different Clusterings

TABLE 3 Average Sizes of 100 Reducts Computed for Different Clusterings

TABLE 4 Average Minimal Sizes among 100 Reducts Computed for Different Clusterings

TABLE 5 Distribution of Attributes in Clusterings into 10 Groups Using the Agnes Algorithm

FIGURE 2 A visualization of the clustering trees for five different gene dissimilarity measures, which were cut at a height corresponding to the division into 10 groups.

FIGURE 2 A visualization of the clustering trees for five different gene dissimilarity measures, which were cut at a height corresponding to the division into 10 groups.

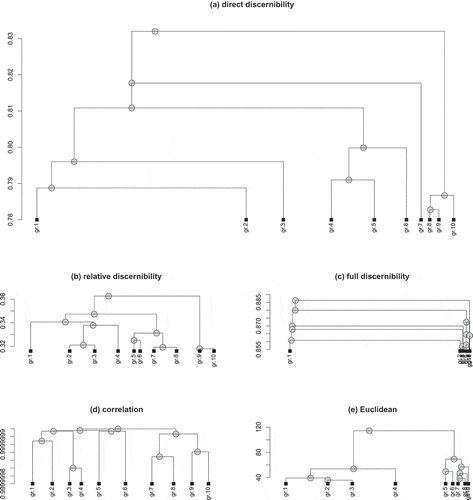
TABLE 6 Performance of the Ordered Reducts (OR) and Ordered Reducts with Diverse Attribute Drawing (OR-DAD) Algorithms with and without Attributes from the Group 1 of the Direct Discernibility Clustering into 10 Groups (Results of 20 Independent Repetitions of the Experiment)

FIGURE 3 Average computation times, minimal and average sizes, and average maximal overlap of reducts computed using the RR-DAS and OR-DAS algorithms based on direct discernibility. Plots correspond to different settings of the attribute sample size used in every iteration of the algorithms.

FIGURE 3 Average computation times, minimal and average sizes, and average maximal overlap of reducts computed using the RR-DAS and OR-DAS algorithms based on direct discernibility. Plots correspond to different settings of the attribute sample size used in every iteration of the algorithms.

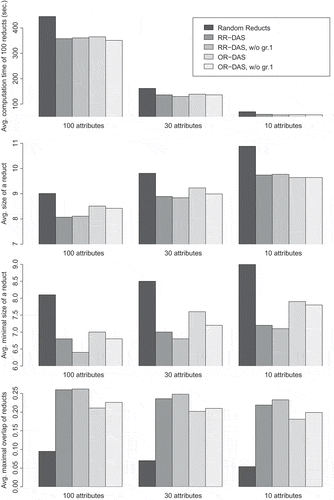
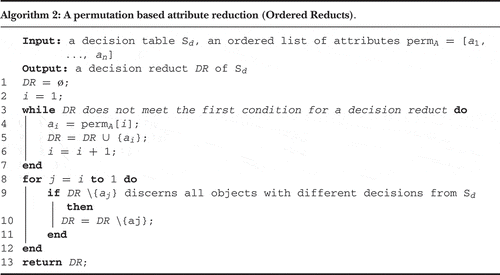
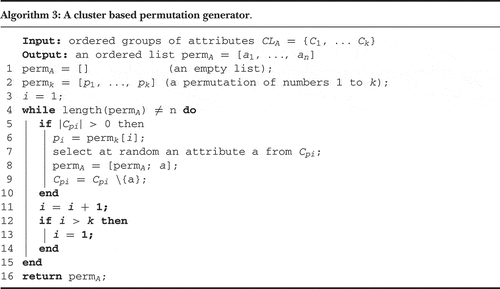
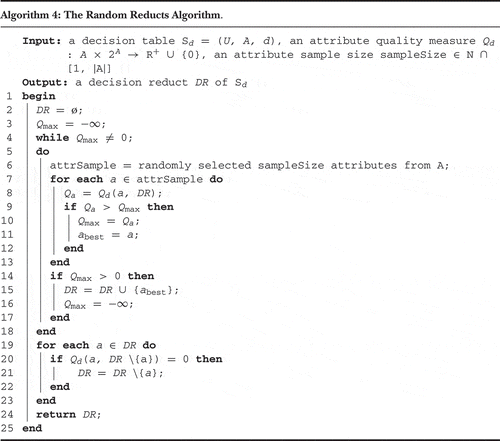
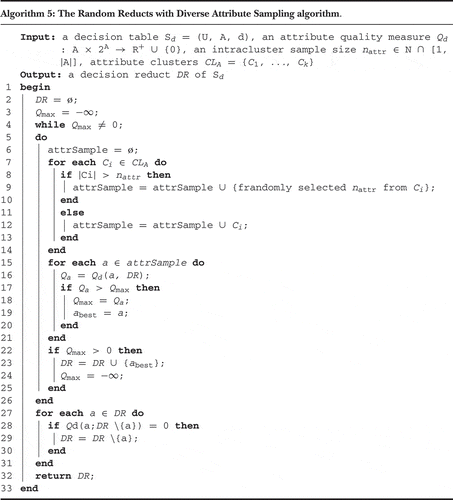
TABLE 7 Stability of an Attribute Selection Using Different Reduct Computation Algorithms

Reprints and Corporate Permissions

Please note: Selecting permissions does not provide access to the full text of the article, please see our help page How do I view content?

To request a reprint or corporate permissions for this article, please click on the relevant link below:

Academic Permissions

Please note: Selecting permissions does not provide access to the full text of the article, please see our help page How do I view content?

Obtain permissions instantly via Rightslink by clicking on the button below:

If you are unable to obtain permissions via Rightslink, please complete and submit this Permissions form. For more information, please visit our Permissions help page.