
Figures & data
FIGURE 1 Gene expression data matrix. © Mark Reimers/Exploratory Analysis. Reproduced by permission of Mark Reimers/Exploratory Analysis. Permission to reuse must be obtained from the rightsholder.
FIGURE 2 Structures of biclusters.
FIGURE 3 Different types of black holes, based on the mass.
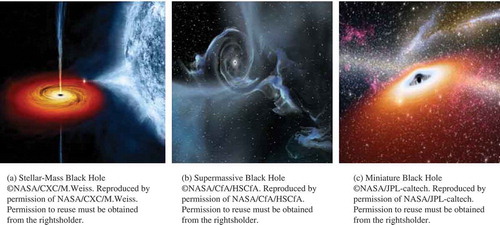
TABLE 1 Comparison of Black Hole Socially Relevant Strategies with Optimization
FIGURE 4 Growth of a black hole.
FIGURE 5 Encoding representation of a bicluster.
FIGURE 6 Representation of the black hole and its mapping to a bicluster.
FIGURE 7 Intersection and union of given two biclusters BCi and BCj.
TABLE 2 Benchmark Functions Used in Experiments
FIGURE 8 Finding the overlapping between the biclusters from BC1 to BC4.
TABLE 3 Best Optimum Values of the SBO, CK, and PSO
TABLE 4 Mean Optimum Values of the SBO, CK, and PSO
TABLE 5 Standard Deviation (Mean) Optimum Values of the SBO, CK, and PSO
TABLE 6 Mean Iteration of the Function Evaluation Values of the SBO, CK, and PSO
FIGURE 9 Plot of number of iterations versus fitness value for yeast stress data.
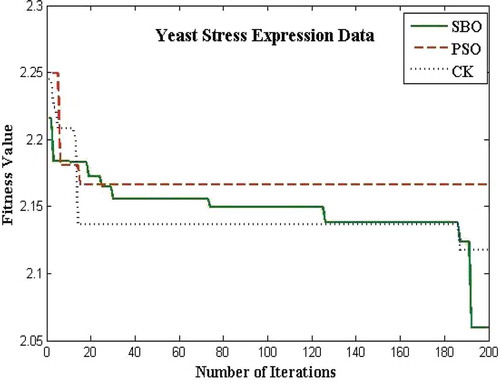
FIGURE 10 Plot of number of iterations versus fitness value for Arabidopsis thaliana data.
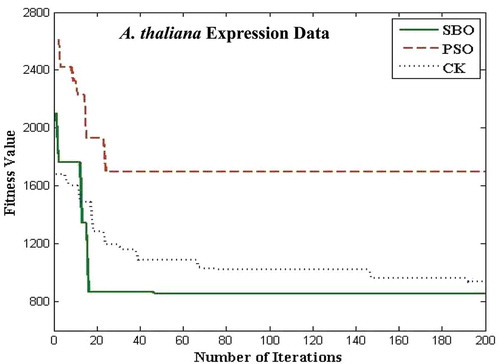
FIGURE 11 Plot of number of iterations versus fitness value for yeast cell cycle data.
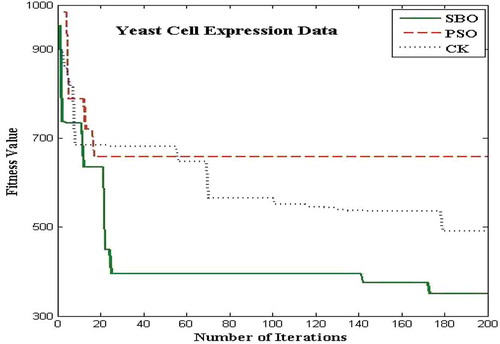
FIGURE 12 Plot of number of iterations versus fitness value for rat CNS data.
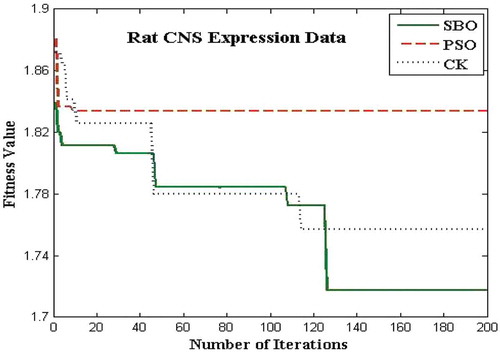
TABLE 7 Experiment Results for Saccharomyces cerevisiae Stress Expression Data
TABLE 8 Experiment Results for Arabidopsis thaliana Expression Data
TABLE 9 Experiment Results for Saccharomyces cerevisiae Cell Expression Data
TABLE 10 Experiment Results for Rat CNS Expression Data
FIGURE 13 Plot of sample biclusters of size 10 × 5 for Arabidopsis thaliana expression data.
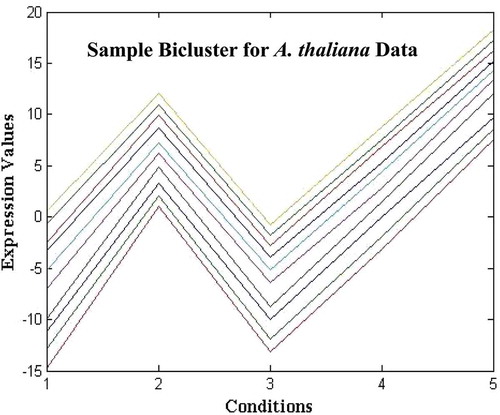
TABLE 11 Significant GO Terms for Three Biclusters on Yeast Stress Data
FIGURE 14 Gene ontology biological process of yeast stress data with 10 genes.
TABLE 12 Functional Annotation for Bicluster on Arabidopsis thaliana Data