
Figures & data
FIGURE 1 Framework for DAI integrated approach to bearing prognostics Key: DAI-degradation assessment index; MLP-multilayer perceptron; RBF-radial basis function; BLR-Bayesian linear regression; GMR-Gaussian mixture regression; GPR-Gaussian process regression; RUL-remaining useful life.
FIGURE 2 Setup.
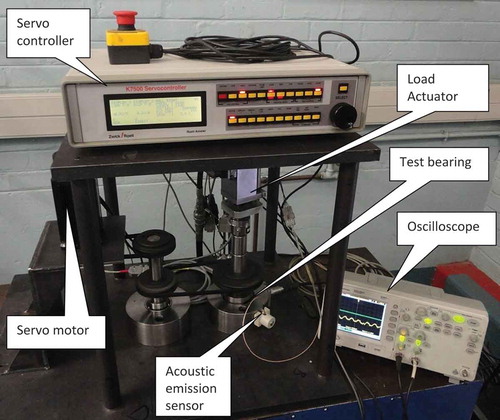
FIGURE 3 RMSE and MAPE for MLP, RBF, BLR, GMR, and GPR models for Bearing 1, based on the dependent samples.
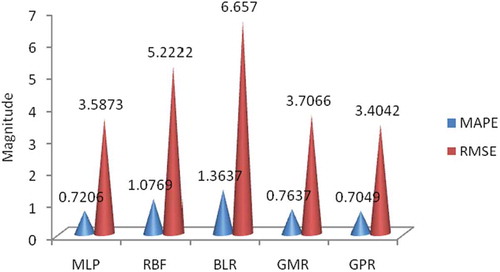
FIGURE 4 RMSE and MAPE for MLP, RBF, BLR, GMR, and GPR models for Bearing 2, based on the dependent samples.
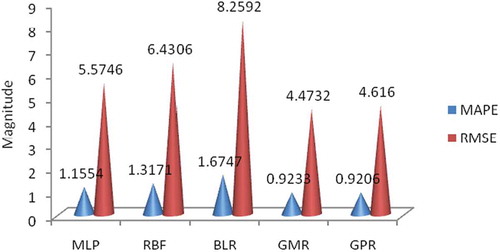
FIGURE 5 RMSE and MAPE for MLP, RBF, BLR, GMR, and GPR models for Bearing 3, based on the dependent samples.
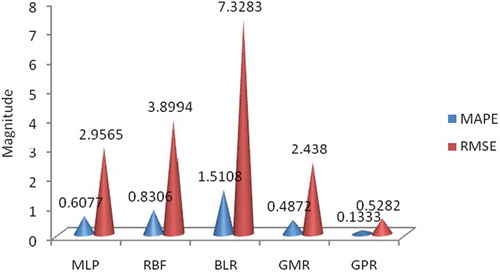
FIGURE 6 Prediction for the whole bearing life for Bearing 1 using different methodologies based on dependent samples.
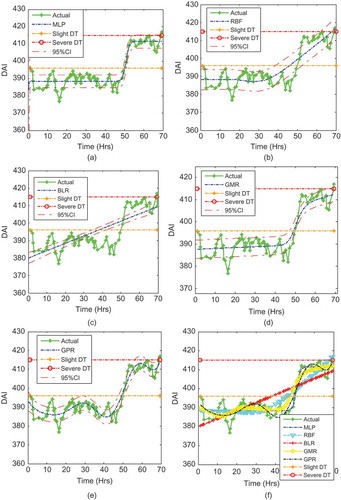
FIGURE 7 Prediction for the whole bearing life for Bearing 2 using different methodologies based on dependent samples.
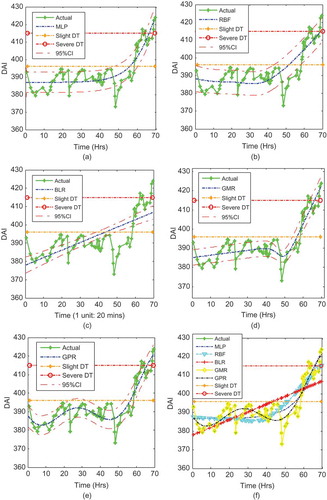
FIGURE 8 Prediction for the whole bearing life for Bearing 3 using different methodologies based on dependent samples.
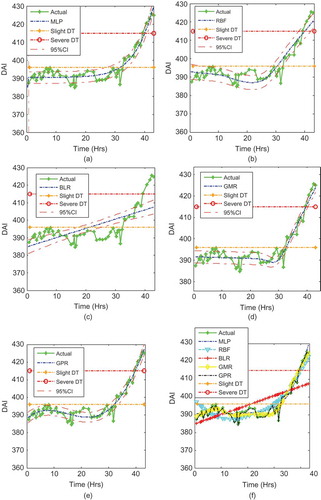
FIGURE 9 RMSE and MAPE for MLP, RBF, BLR, GMR, and GPR models for Bearing 1, based on the independent samples.
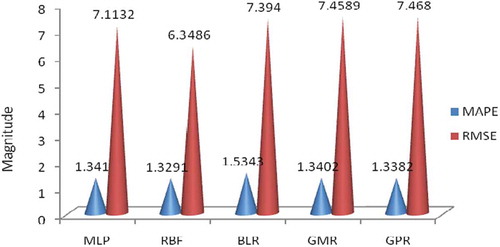
FIGURE 10 RMSE and MAPE for MLP, RBF, BLR, GMR, and GPR models for Bearing 2, based on the independent samples.
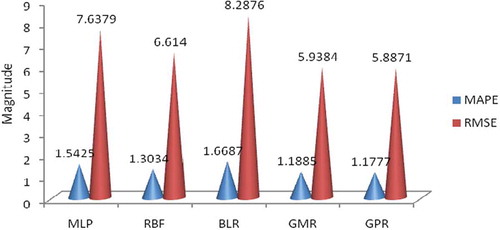
FIGURE 11 RMSE and MAPE for MLP, RBF, BLR, GMR, and GPR models for Bearing 3, based on the independent samples.
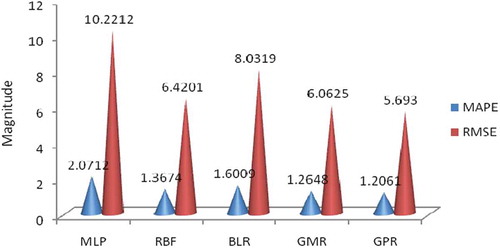
FIGURE 12 Prediction for the whole bearing life using Bearing 2 and 3 as training set and Bearing 1 as test set based on different methodologies and independent samples.
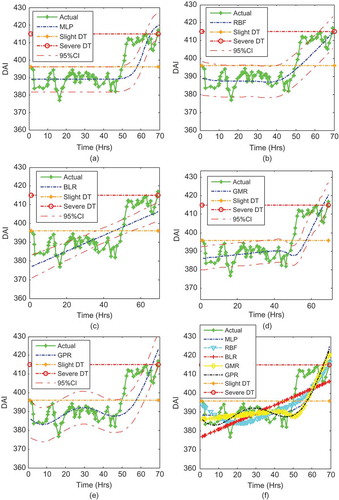
FIGURE 13 Prediction for the whole bearing life using Bearing 1 and 3 as training set and Bearing 2 as test set based on different methodologies and independent samples.
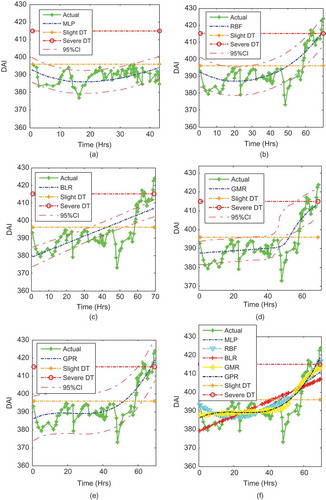
FIGURE 14 Prediction for the whole bearing life using Bearing 1 and 2 as training set and Bearing 3 as test set based on different methodologies and independent samples.
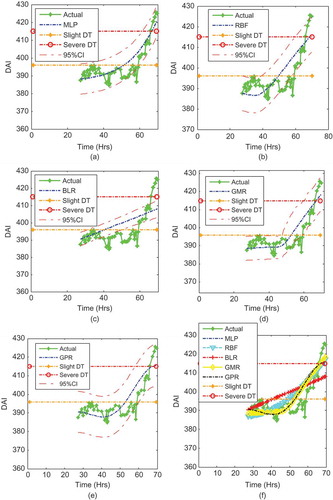
TABLE 1 Ranking of Models Based on Dependent and Independent Samples for Bearing 1
TABLE 2 Ranking of Models Based on Dependent and Independent Samples for Bearing 2
TABLE 3 Ranking of Models Based on Dependent and Independent Samples for Bearing 3