Figures & data
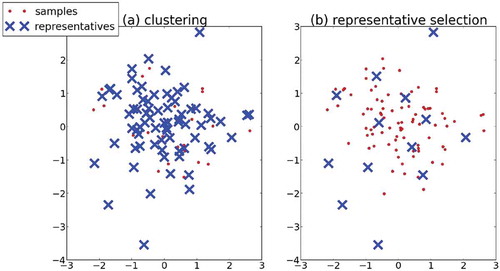
FIGURE 1 Clustering vs. representative selection. (a) When applying k-medoids, k = 77 clusters are required to satisfy the distance condition. (b) A better representative set does so with only 13 representatives.
Table
Table
Table
FIGURE 2 Three musical segments as pitch (in MIDI format) over time, along with the musical notation of the first segment (1stViolinSeg).
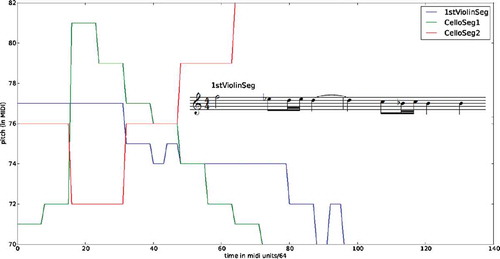
FIGURE 3 Representative set size percentage from entire set and average representative set distance for three different composers, ten different pieces each, and five different distance criteria. Each column represents data for a different composer; δ-medoids yields the most compact representative set overall while still obtaining a smaller average distance than the k-centers heuristic.
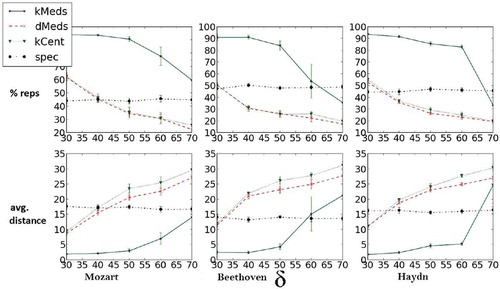
FIGURE 4 The RoboCup 2D Simulation. Three potential movement trajectories for a specific agents are marked.
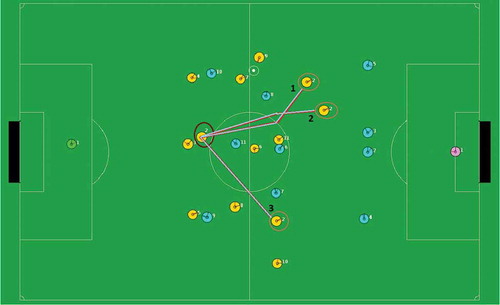
FIGURE 5 Representative set size percentage from entire set for four different teams, five different game logs each, and five distance criteria. Each column represents game data for a different team. Axes denoting distance are in log-scale.
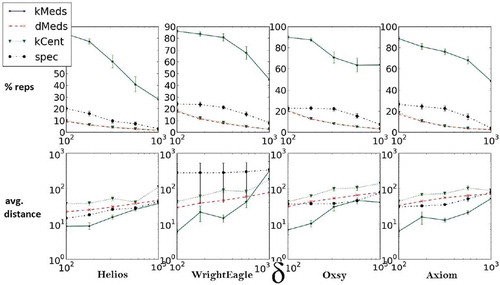
FIGURE 6 The histograms (plotted as density functions, i.e., counts normalized as percentages) of the average overlap between representative sets found for each method for the same data under different permutations (overlap measured in %). For k-medoids, δ-medoids, and the k-centers heuristic, in more than 90% of the datasets, there was a > 90% average overlap. Spectral clustering yields drastically less consistent representation sets. The overlaps observed are almost exactly the same, implying that the expected extent of overlap depends more on the structure of the data than on the type of randomization the algorithm employs.
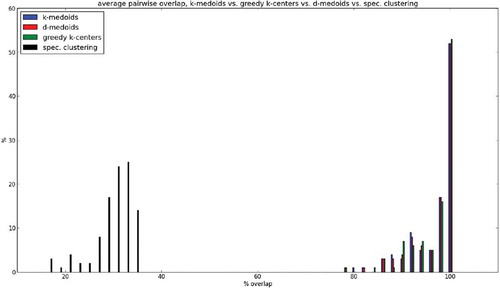
FIGURE 7 Representative set size percentage from entire set and average representative set distance for four different multivariate Gaussian distributions from which the samples are drawn, 20 different experiments each, and four different distribution values. Each column represents data for a different distribution; δ-medoids yields the most compact representative set overall while still obtaining a smaller average distance than the k-centers heuristic.
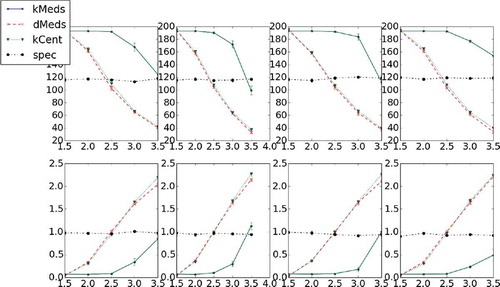
FIGURE 8 Two segments for example, in musical notation.
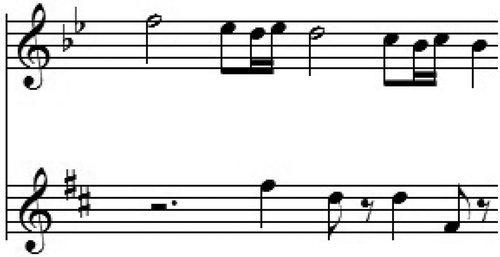
FIGURE 9 Same two segments, plotted as midi pitch over time.
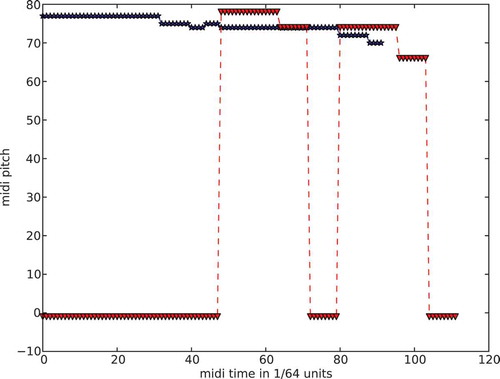
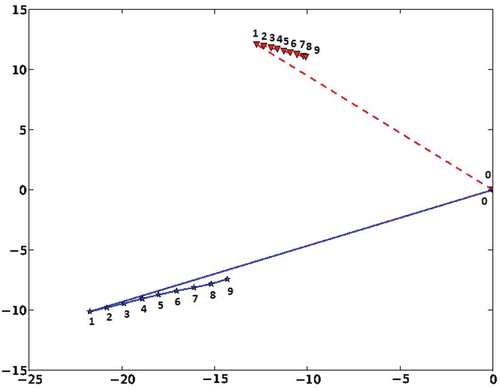
FIGURE 10 Two movement segments. Each coordinate in the trajectory is labeled with its timestamp in the trajectory . Both segments begin with a long sprint toward one direction and then a sequence of small steps in the opposite direction (scales are × 10).