Figures & data
Figure 1. (a) Xsens MTx (Xsens Citation2016) and (b) 3DM-GX2 (MicroStrain Citation2016) sensor units.
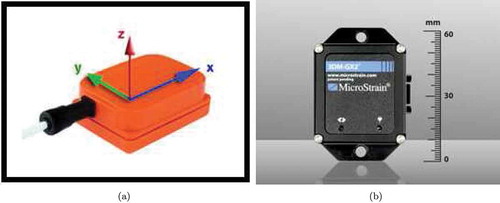
Figure 2. (a) Motion sensor units worn on the body (Xsens Citation2016) © Xsens. Reproduced by permission of Xsens. Permission to reuse must be obtained from the rightsholder. (b) An active RFID tag (SYRIS SYSTAG245-TM-B) worn as a bracelet (SYRIS Citation2016) © SYRIS. Reproduced by permission of SYRIS. Permission to reuse must be obtained from the rightsholder. (c) An RFID tag inserted under the skin © GeekWire.com. Reproduced by permission of GeekWire.com. Permission to reuse must be obtained from the rightsholder. (d) Tiny RFID tags of size 2mm x 2mm © Tagent Corp. Reproduced by permission of Tagent Corp. Permission to reuse must be obtained from the rightsholder.
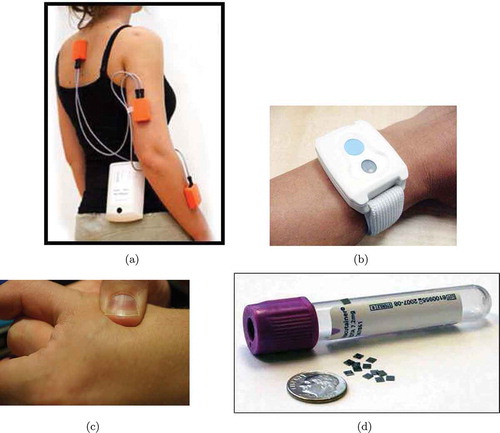
Figure 3. Ubisense hardware components (Steggles and Gschwind Citation2005). © Ubisense. Reproduced by permission of Ubisense. Permission to reuse must be obtained from the rightsholder.
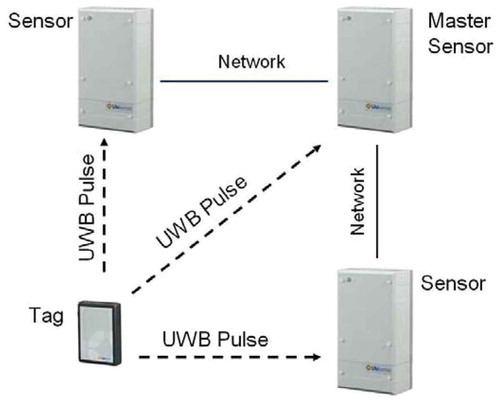
Figure 4. Sample rows of the original dataset.
Figure 5. The positions of (a) tag 1 and (b) tag 3 in the first experiment of the first subject as 3D curves whose gray level changes from light gray to black over time.
Figure 6. The three curve-fitting methods applied to synthetic position data.
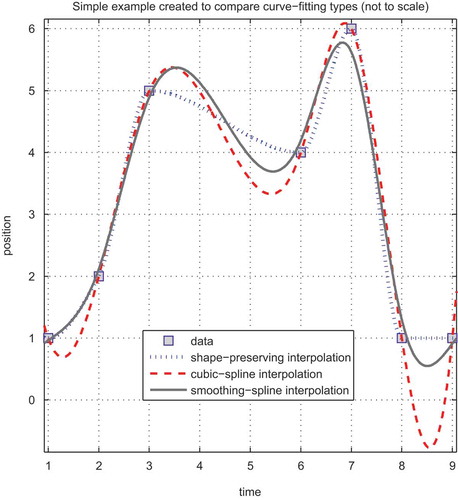
Figure 7. The x position of tag 4 in the fifth experiment of the fifth subject. (a) The whole curve and (b) the zoomed-in version.
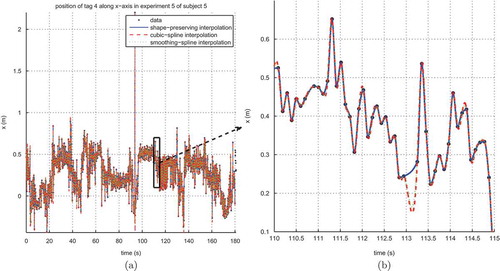
Table 1. The average probability of error (weighted by prior probabilities) of the 10 classifiers, for the 11- and 5-class problems and the two cross-validation techniques. In each case, the combination of parameters leading to the most accurate classifier is given in parentheses.
Table 2. Cumulative confusion matrices for classifier 6 (k-NN) for the 11-class problem. The confusion matrices are summed up for the five executions of the 5-fold (top) and subject-based L1O (bottom) cross validation.
Table 3. Cumulative confusion matrices for classifier 6 (k-NN) for the 5-class problem. The confusion matrices are summed up for the five executions of the 5-fold (left) and subject-based L1O (right) cross validation.
Figure 8. Effect of sampling frequency on the average classification error of the k-NN classifier (classifier 6).
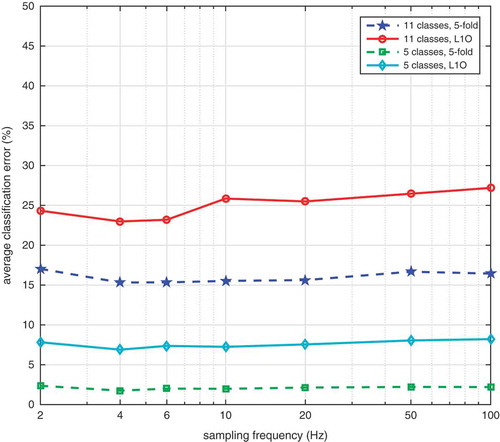
Figure 9. Effect of segment duration on the average classification error of the k-NN classifier (classifier 6).
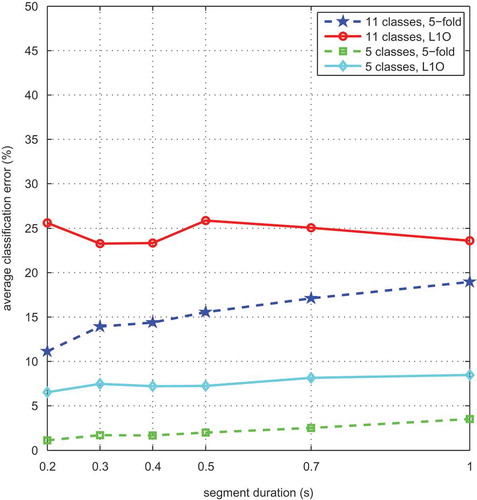
Figure 10. Effect of curve-fitting method on the average classification error of the k-NN classifier (classifier 6).
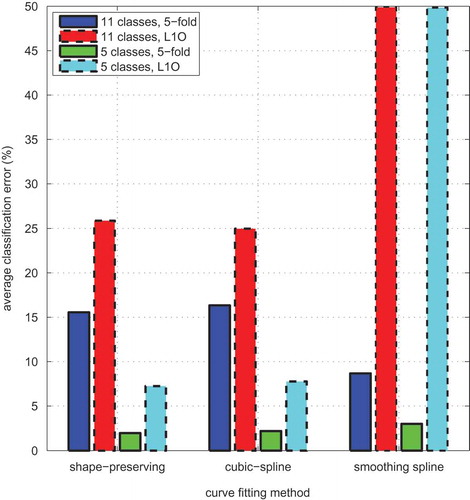
Figure 11. Effect of prior probabilities on the average classification error of the k-NN classifier (classifier 6).
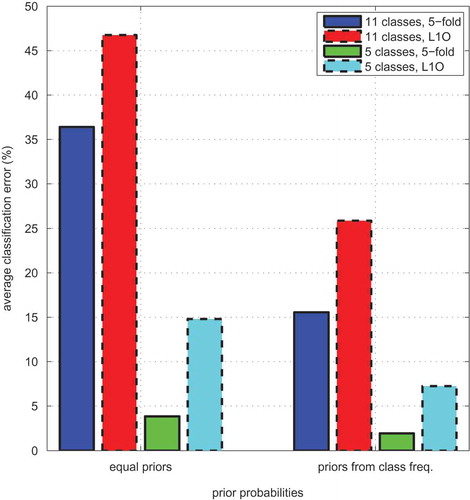
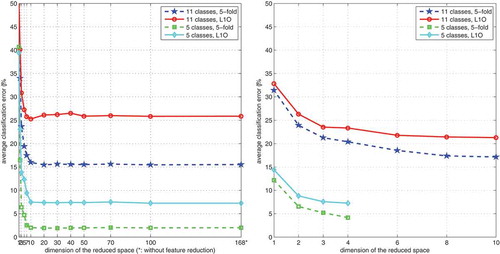
Figure 12. Effect of feature reduction with (a) PCA and (b) LDA on the average classification error of the k-NN classifier (classifier 6).