
Figures & data
Figure 1. An example of an ECG signal with marked folds.
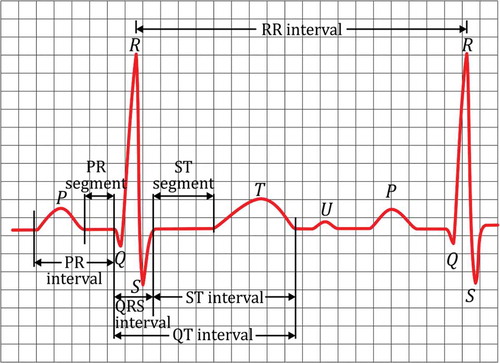
Figure 2. The fragments of ECG signals’ records from the MIT-BIH base: (a) signal 105, (b) signal 108, (c) signal 203, (d) signal 222.
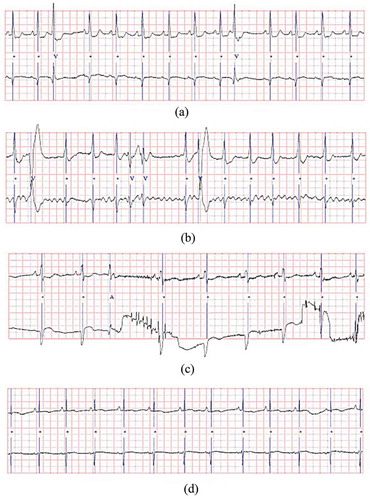
Table 1. The energy of signal’s residuum depending on decomposition level.
Table 2. The maximum and minimum detection error for the given threshold value.
Table 3. The accuracy of detection in relation to the number of neurons in the hidden layer.
Table 4. The accuracy of the QRS complex detection in relation to the activation function.
Table 5. Comparison of average measure values of detection and sensitivity for different solutions.
Table 6. The comparison of detection error and sensitivity for signals: 105, 108, 203, and 222.