
Figures & data
Figure 1. Flowchart for the MACO-P algorithm.
Figure 2. Pseudocode for the preemptive sub algorithm.
Figure 3. Pseudocode for the MACO-P algorithm.
Figure 4. Snapshots of various networks used: (a) simple road network, (b) complex road network, (c) University of Delhi network, and (d) North West Delhi network.
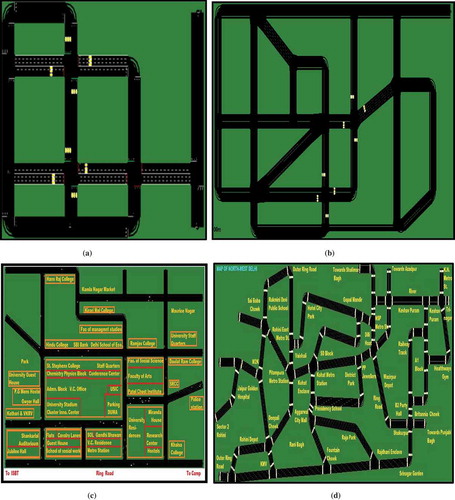
Table 1. Waiting and travel times in various networks.
Figure 5. Overall waiting time in various networks: (a) simple road network, (b) complex road network, (c) University of Delhi network, and (d) North West Delhi network..
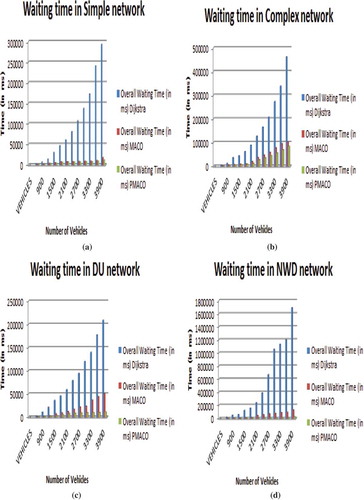
Figure 6. Overall travel time in various networks: (a) simple road network, (b) complex road network, (c) University of Delhi network, and (d) North West Delhi network.
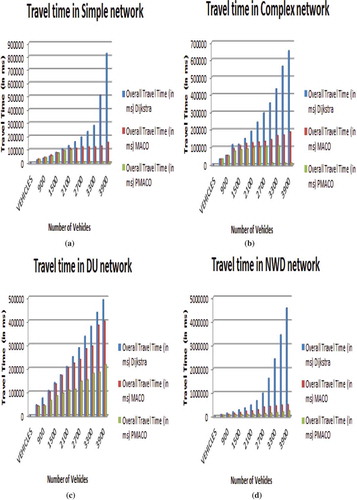
Table 2. t-test for Dijkstra, MACO and MACO-P algorithms in various networks in terms of travel time.