Figures & data
Figure 1. Structure of the proposed technique.
Figure 2. (a) The original mammogram image, (b) cropped image and (c) image filtered with CLAHE.
Table 1. Initializes CLAHE.
Figure 3. (a) The histogram chart of the original mammogram image. (b) The histogram chart of the CLAHE image.
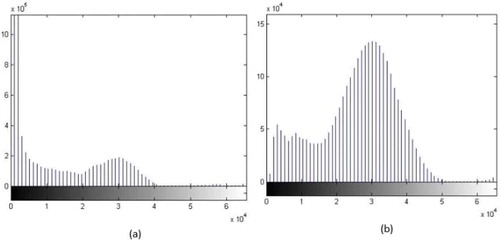
Table 2. Features identified by GLCM on MIAS images.
Table 3. Variables from that had the greatest impact on the diagnosis and classification of a cancer image.
Figure 4. Cloud level with maximum separating border along with separating borders, for classification of the data samples into two different classes.
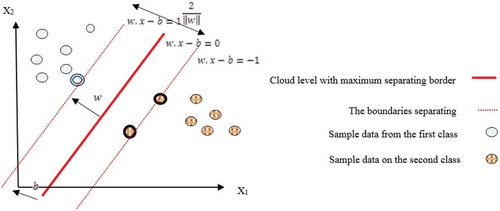
Figure 5. Variables from that had the greatest impact on the diagnosis and classification.
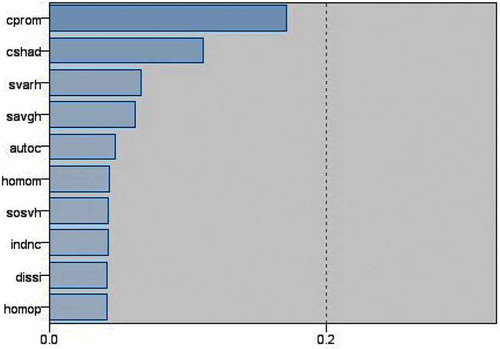
Table 4. Results obtained by our method.
Table 5. Confusion matrix.
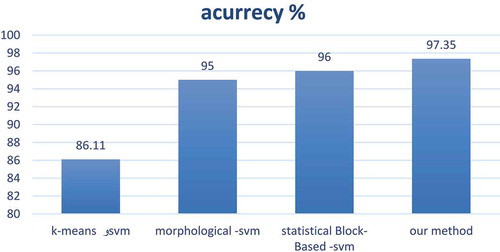
Figure 6. The new method proposed compared with other similar methods.