
Figures & data
Figure 1. Flowchart of the proposed approach.
Figure 2. “0027” image from subset1, (a) GT image, (b) segmented mask image by BM, (c) segmented mask image by GF2T, (d) original image, (e) extracted object image by BM, and (f) extracted image by GF2T.
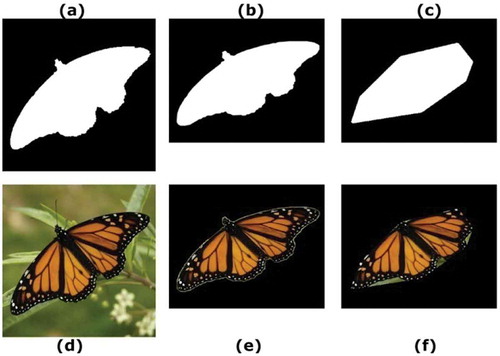
Figure 3. “0049” image from subset2, (a) GT image, (b) segmented mask image by BM, (c) segmented mask image by GF2T, (d) original image, (e) extracted object image by BM, and (f) extracted image by GF2T.
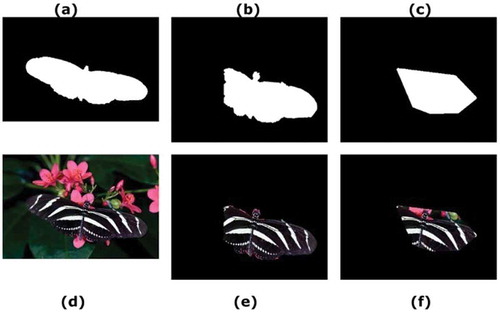
Figure 4. “0002” image from subset3, (a) GT image, (b) segmented mask image by BM, (c) segmented mask image by GF2T, (d) original image, (e) extracted object image by BM, and (f) extracted image by GF2T.
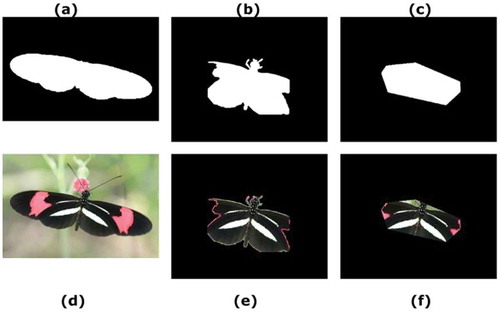
Figure 5. “0037” image from subset4, (a) GT image, (b) segmented mask image by BM, (c) segmented mask image by GF2T, (d) original image, (e) extracted object image by BM, and (f) extracted image by GF2T.
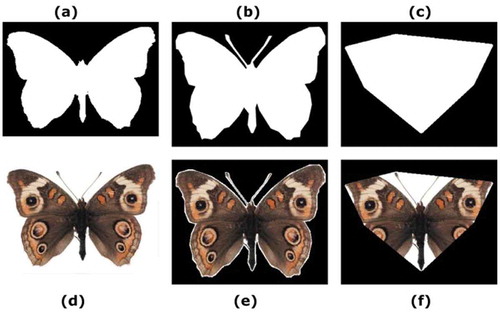
Figure 6. “0023” image from subset5, (a) GT image, (b) segmented mask image by BM, (c) segmented mask image by GF2T, (d) original image, (e) extracted object image by BM, and (f) extracted image by GF2T.
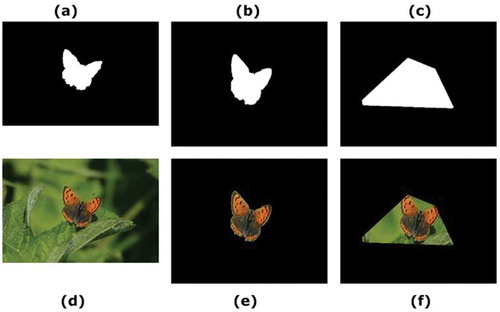
Table 1. BoMISe’s algorithm.
Table 2. The quantitative evaluation of performance based on the precision metric. The results shown in bold in the table indicate the best performance values.
Table 3. The quantitative evaluation of performance based on the recall metric. The results shown in bold in the table indicate the best performance values.
Table 4. The quantitative evaluation of performance based on the F-measure metric. The results shown in bold in the table indicate the best performance values.
Table 5. The quantitative evaluation of performance based on the Jaccard metric. The results shown in bold in the table indicate the best performance values.
Table 6. The quantitative evaluation of performance based on the kappa metric. The results shown in bold in the table indicate the best performance values.
Table 7. The overall performance results obtained for five image subsets. The results shown in bold in the table indicate the best performance values.