Figures & data
Figure 1. Audit work-flow.
Table 1. Target sectors.
Table 2. Risk factors classification and other features in model.
Table 3. Sample data of the corporate sector unit.
Figure 2. Proposed framework for an audit field work decision-making.
Table
Figure 3. Prediction model.
Table 4. Risk factors weight assignment using Particle Swarm Optimization (PSO).
Table 5. Confusion matrix.
Table 6. Performance evaluation metrics.
Table 7. Machine learning classification methods.
Table 8. Average performance comparison of machine learning methods for the prediction of an audit risk on testing dataset.
Figure 4. Performance score of SAW and TOPSIS MCDM methods.
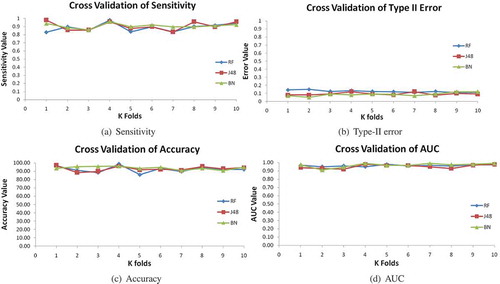
Figure 5. Ten-fold cross validation of Type-II error, sensitivity, accuracy, and AUC on the testing dataset in the audit risk prediction using Bayes Net, J48, and Random Forest.