Figures & data
Figure 1. Synthetic data S1 (a) and S2 (b) (from left to right).
Table 1. The characteristics of images.
Figure 2. Real images used for experimentations.
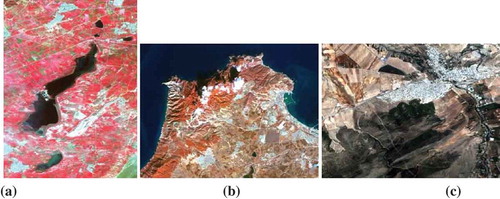
Figure 3. Variation of the DB index with respect to the number of clusters for the S1 data set with all methods.
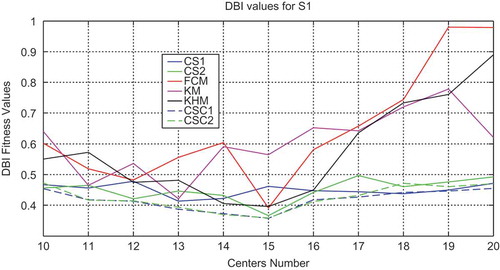
Figure 4. Variation of the XB index with respect to the number of clusters for the S1 data set with all methods.
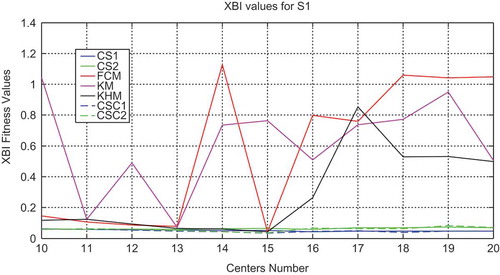
Figure 5. Variation of the DB index with respect to the number of clusters for the S1 data set with all methods.
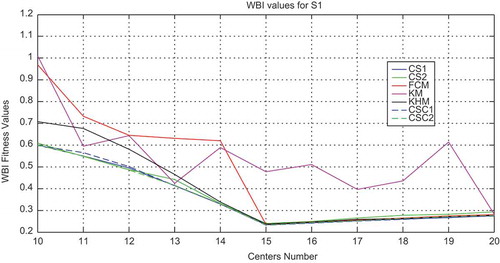
Table 2. Comparison of the optimal number of clusters obtained by the different algorithms in conjunction with the DB index, the XB index, and WB index – case of the S1 data set.
Figure 6. Variation of the DB index with respect to the number of clusters for the S2 data set with all methods.
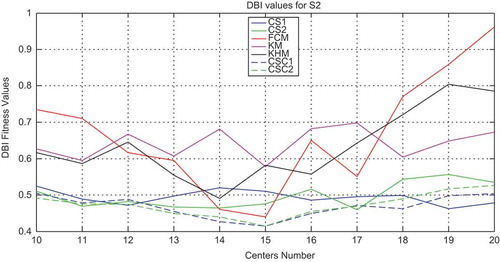
Figure 7. Variation of the XB index with respect to the number of clusters for the S2 data set with all methods.
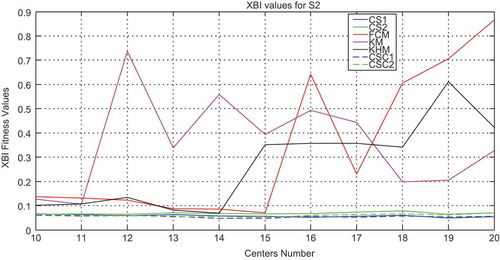
Figure 8. Variation of the WB index with respect to the number of clusters for the S2 data set with all methods.
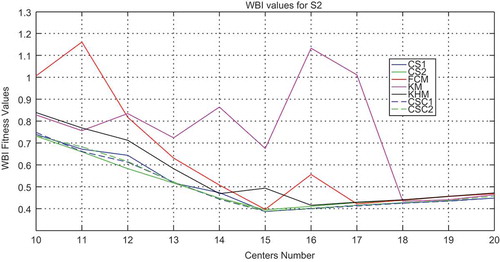
Table 3. Comparison of the number of clusters obtained by the different algorithms in conjunction with the DB index, the XB index, and WB index – case of the S2 data set.
Figure 9. The histogram of the first image data set.
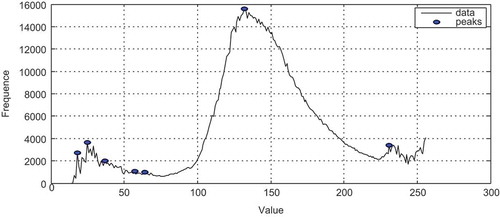
Table 4. Comparison of the number of clusters obtained by the different algorithms in conjunction with the DB index, the XB index, and WB index – case of the first real image.
Table 5. Comparison of the number of clusters obtained by the different algorithms in conjunction with the DB index, the XB index, and WB index – case of the second real image.
Table 6. Comparison of the number of clusters obtained by the different algorithms in conjunction with the DB index, the XB index, and WB index – case of the third real image.
Figure 10. Clustered images of Oran with DB index (a i), XB index, (b i), and WB index (c i) using (i = 1) KM, (i = 2) KHM, (i = 3) FCM, (i = 4) CS1, (i = 5) CS2, (i = 6) CSC1, and (i = 7) CSC2.

Figure 10. Continued.
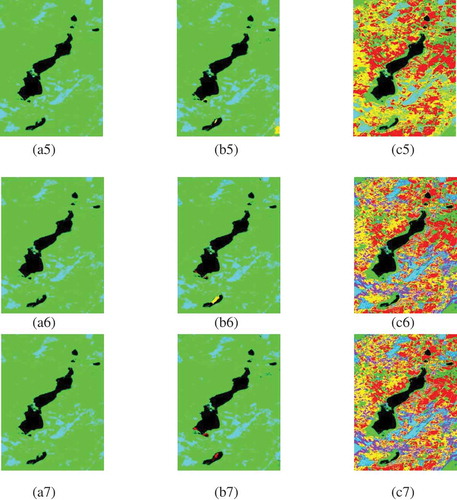
Figure 11. The number of pixels in each cluster obtained by all the methods using WB index.
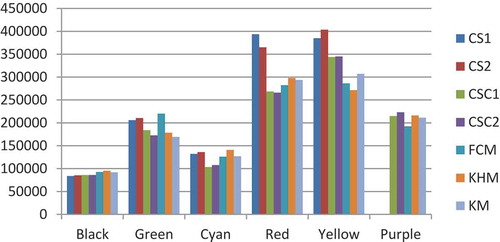
Figure 12. Water body extraction results of the first image with WB index using (a) FCM, (b) CSC1, (c) CSC2, and (d) ground truth.