Figures & data
Figure 1. The CRISP-DM tool.
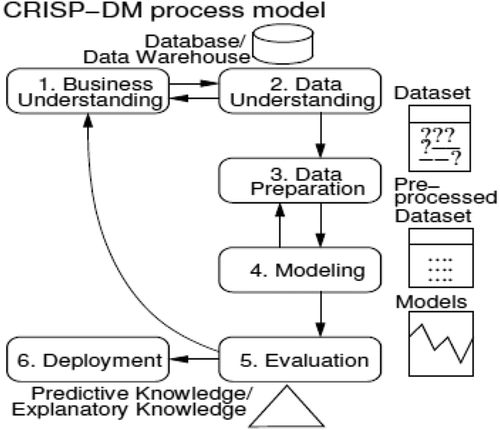
Figure 2. MLP neural network (left) and SVM (right).
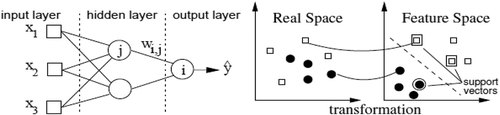
Table 1. Comparison between SVM and MLPE methods for MM disease diagnosis in terms of average performance evolutions by 10-fold crossvalidation in 5-run test methods.
Table 2. Average of classification accuracies for MM disease dataset by 10-fold crossvalidation in 5 runs.
Table 3. Comparison of different methods used to measure the performance evolution for MM disease diagnosis in terms of average classification accuracy.
Figure 3. LIFT plot for MM disease diagnosis using SVM and MLPE neural network.
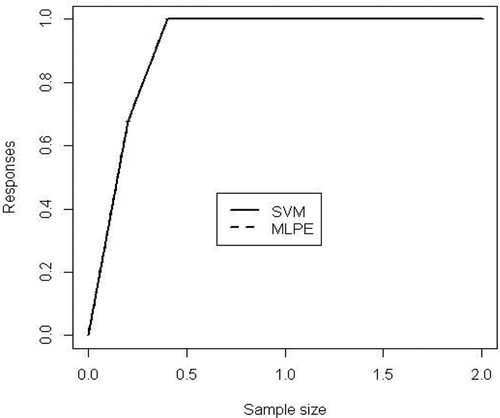
Figure 4. Input importance bar charts for MM disease diagnosis using 34 input variables.
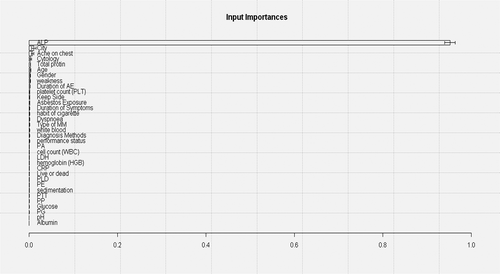
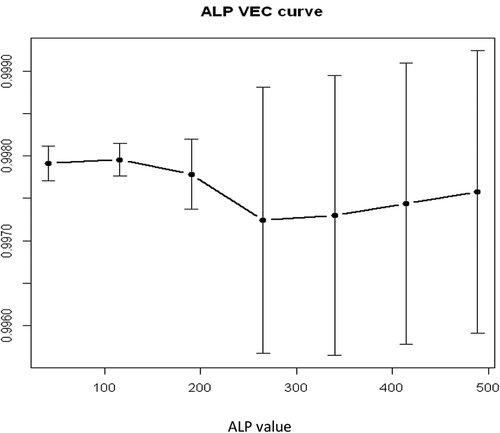
Figure 5. Variable effect curve for the input variable ALP.