
Figures & data
Figure 1. Fifty randomly selected heartbeat signals for (a) Class N, (b) Class L, (c) Class R, (d) Class V, (e) Class A.
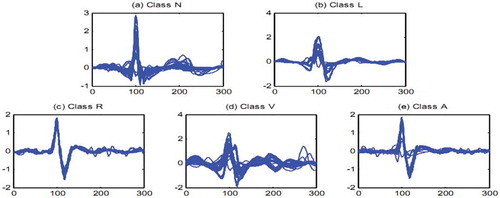
Table 1. Heartbeat classes given by the MIT-BIH database along with the regrouping defined by the AAMI standard.
Figure 2. Example of CNN architecture (Mathworks online resource, Citation2017).
Figure 3. Visualization of the parameter setup at i-th ReLU and k-th ADD (Yang and Ramanan Citation2015).
Figure 4. Overview of proposed DAG-CNN method.
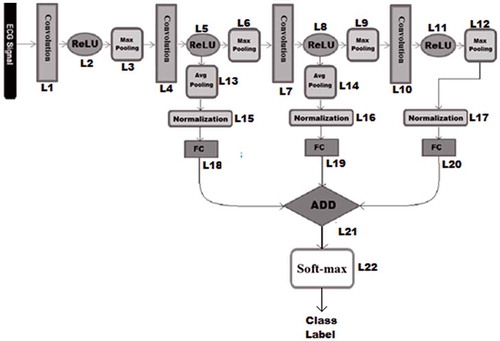
Table 2. Summary of the training and testing heartbeat samples.
Table 3. The details of back-bone CNN architecture of DAG-CNN model.
Table 4. Different heartbeat types classification result.
Table 5. Four heartbeat types classification metrics compared to the state-of-the-art (percentage, %).
Table 6. SVEB and VEB Classification metrics compared to the state-of-the (percentage, %).