Figures & data
Table 1. Review of related work in biclustering gene expression data.
Algorithm 1. Pseudo code for SCS-NM.
Table 2. Dataset description.
Figure 1. Plot of number of iterations versus fitness value for yeast stress data.
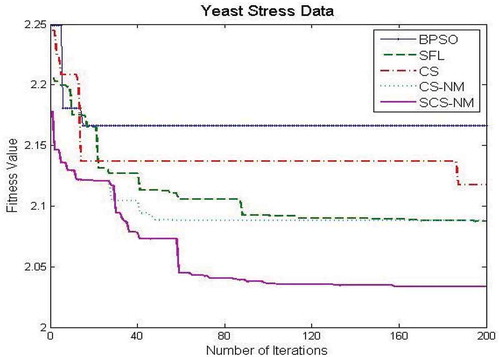
Figure 2. Plot of number of iterations versus fitness value for Arabidopsis thaliana data.
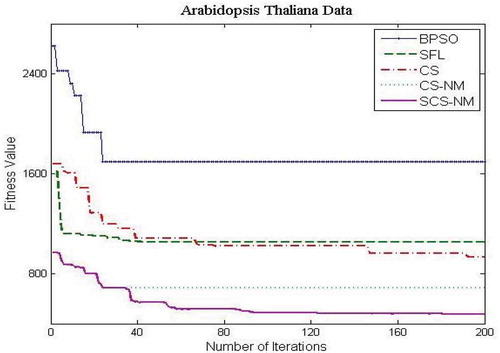
Figure 3. Plot of number of iterations versus fitness value for yeast cell-cycle data.
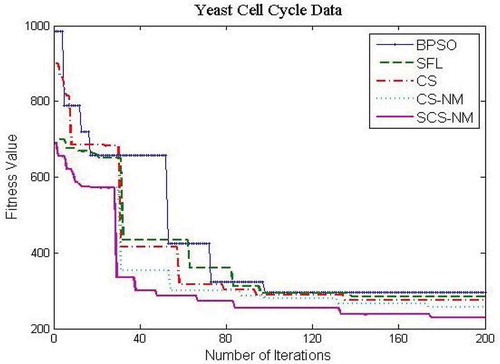
Figure 4. Plot of number of iterations versus fitness value for rat CNS data.
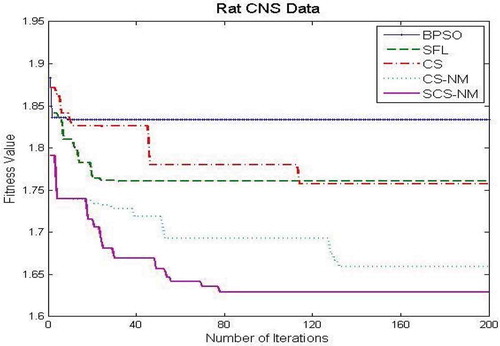
Table 3. Experiment results for Saccharomyces cerevisiae cell expression data.
Figure 5. Plot of sample biclusters of size 8 × 5 for Arabidopsis thaliana data.
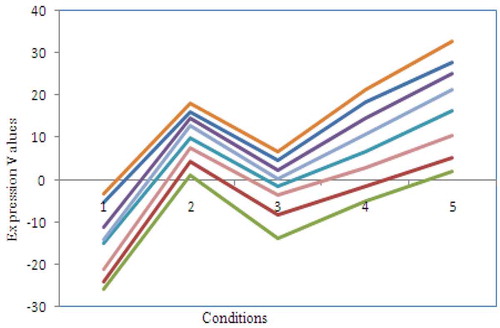
Table 4. Comparative analysis on yeast cell expression data.
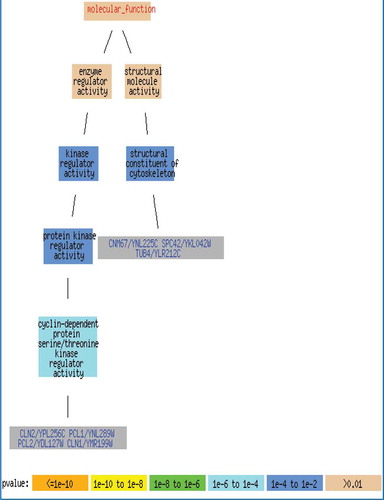
Figure 6. Plot of proportions of biclusters significantly enriched by GO annotations on yeast cell-cycle data.
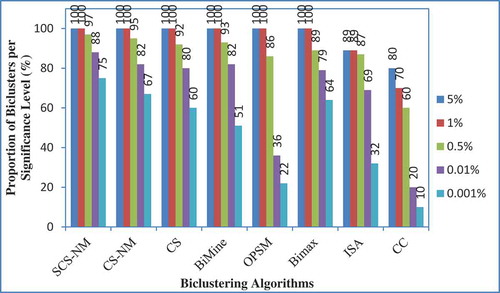
Table 5. Significant GO terms for three biclusters on Saccharomyces cerevisiae data.
Figure 7. Plot of Gene Ontology biological process of yeast cell-cycle data (10 genes).