
Figures & data
Figure 1. The structure of an auto-encoder.
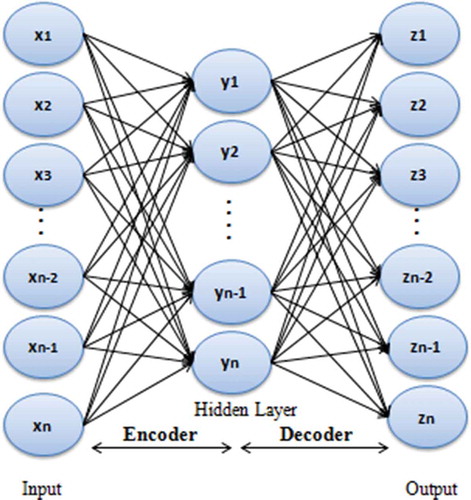
Figure 2. The structure of the used stacked auto-encoders with softmax layer.
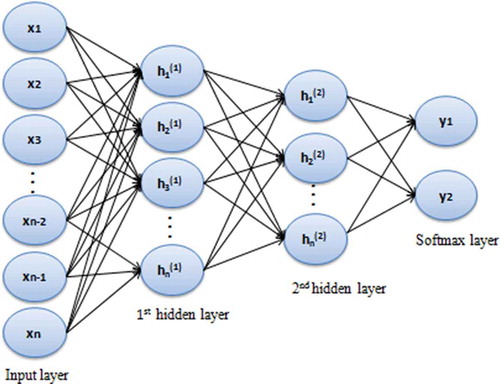
Table 1. Financial ratios of darden dataset.
Table 2. Financial ratios of polish dataset.
Table 3. A confusion matrix.
Figure 3. The impact of the number of SAE hidden layers and the number of hidden units on classification accuracy for Darden dataset.
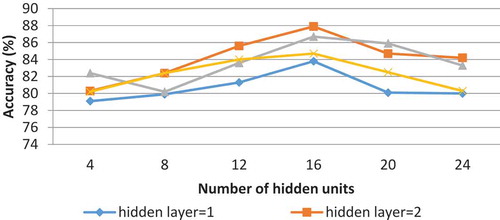
Figure 4. The impact of the number of SAE hidden layers and the number of hidden units on classification accuracy for Polish dataset.
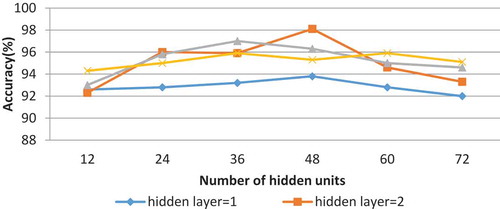
Table 4. Comparison of our approach with similar works for Darden dataset.
Table 5. Comparison of our approach with similar works for Polish dataset.