Figures & data
Table 1. MSE of various methods for benchmark functions.
Figure 1. Comparison of fitting results for benchmark function 1.
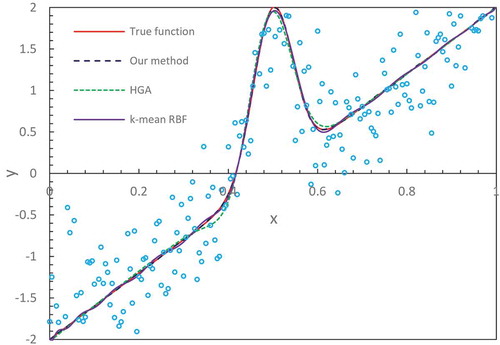
Figure 2. Comparison of fitting results for benchmark function 2.
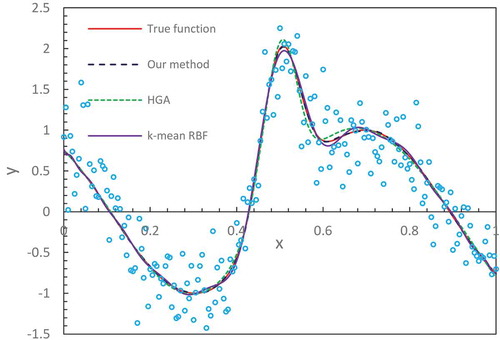
Figure 3. Fitting results for Gaussian2 dataset.
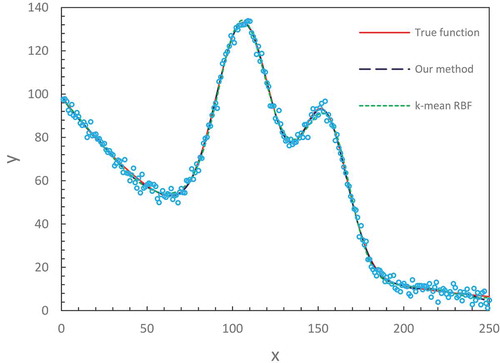
Figure 4.A fitting result for Lorentzian line shape.
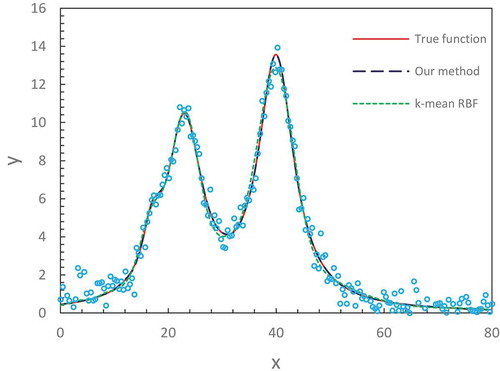
Figure 5.A fitting result for Voigt line shape.
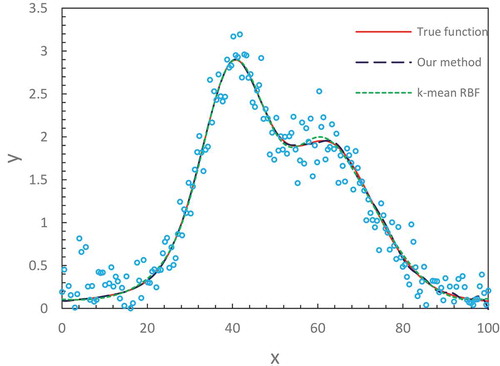
Figure 6. Comparison of fitting results between our method and Paul’s empirical fitting. (a) O→C, (b) O→Al, (c) O→Si.
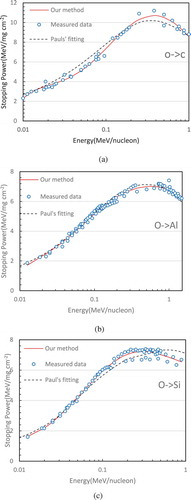
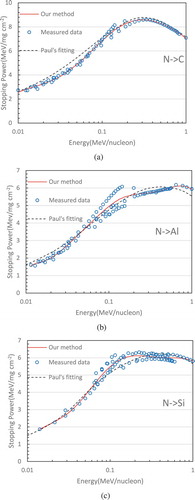
Figure 7. Comparison of fitting results between our method and Paul’s empirical fitting. (a) N→C, (b) N→Al, (c) N→Si.