Figures & data
Table 1. Design specifications for use in low frequency systems.
Table 2. Values of other technology constants used.
Figure 1. Schematic of RFC OpAmp.
Figure 2. Flowchart of HWPSO algorithm.
Table 3. Comparative analysis of the best results obtained using HWPSO and other algorithms after 20 independent runs.
Table 4. Optimal design parameters corresponding to best results obtained using HWPSO and other algorithms.
Table 5. Comparative results of algorithms in terms of best, worst, mean and standard deviation after more than 20 independent runs.
Table 6. Friedman’s test result considering minimum area for 20 independent runs.
Table 7. Mann Whitney U test result.
Figure 3. (a) Comparative analysis of the convergence plot (b) Box plot for HWPSO for the problem.
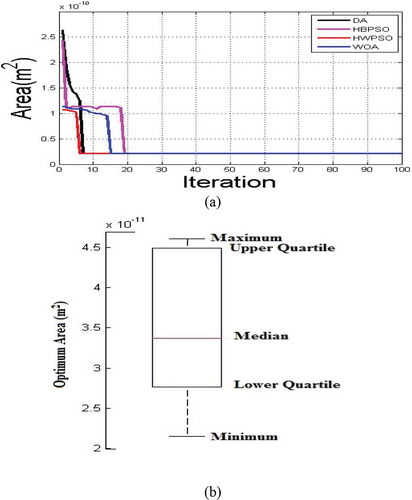
Table 8. Validation results for HWPSO and % deviation.
Figure 4. Comparison of various specifications for the algorithms.
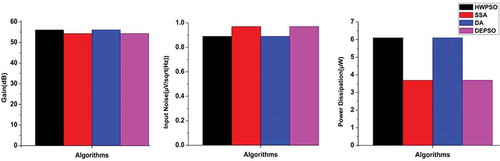
Figure 5. Cadence virtuoso simulated gain plot.
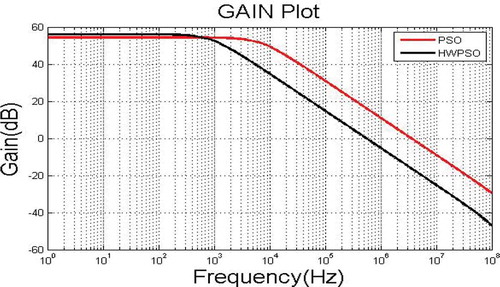
Figure 6. Cadence virtuoso simulated input referred noise plot.
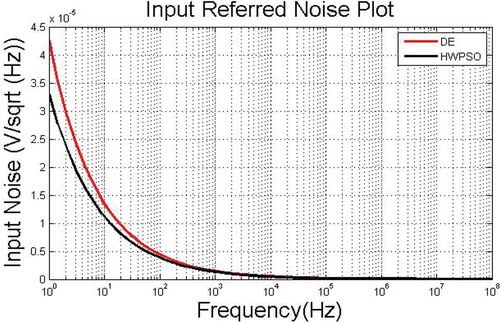
Figure 7. Cadence virtuoso simulated power dissipation plot for HWPSO algorithm.
Figure 8. Cadence virtuoso simulated CMRR plot for HWPSO algorithm.
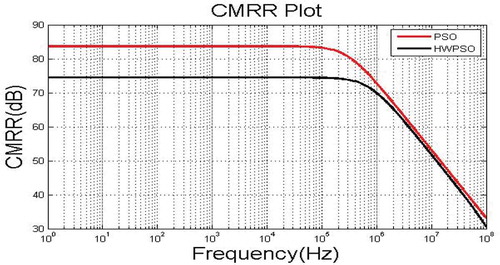
Figure 9. Cadence virtuoso simulated ICMR plot for HWPSO algorithm.
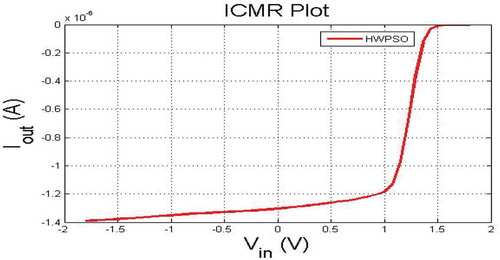
Figure 10. Cadence virtuoso simulated PSRR plot for HWPSO algorithm.
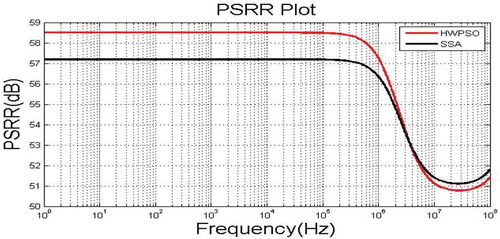
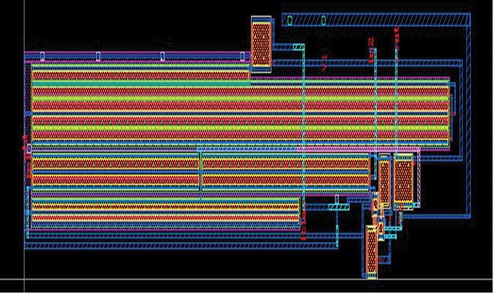
Figure 11. Layout of RFC OpAmp in cadence virtuoso.