Figures & data
Table 1. The historical memory
Table 2. The parameters of algorithms and their values
Table 3. Wilcoxon signed rank test between HGSCADE and other algorithms for the CEC2014 functions with D = 30 at a 5% level of significance
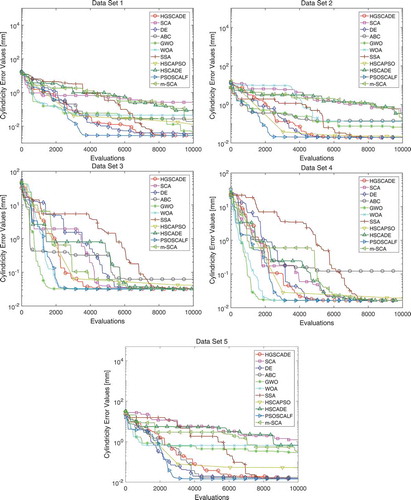
Table 4. The cylindricity error evaluation results of different algorithms
Figure 1. The convergence curves of all algorithms for certain CEC2014 functions (H3, H13, H20, and H30) with D = 30
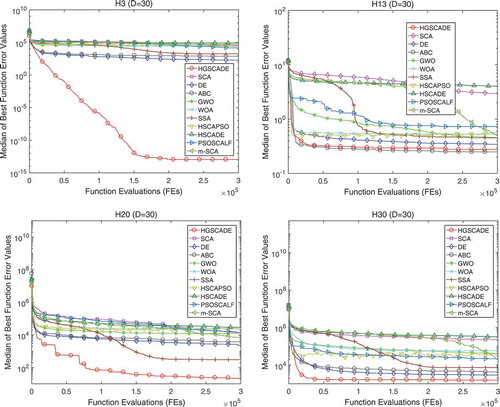
Figure 2. The convergence curves of all algorithms for certain CEC2014 functions (H3, H13, H20, and H30) with D = 50
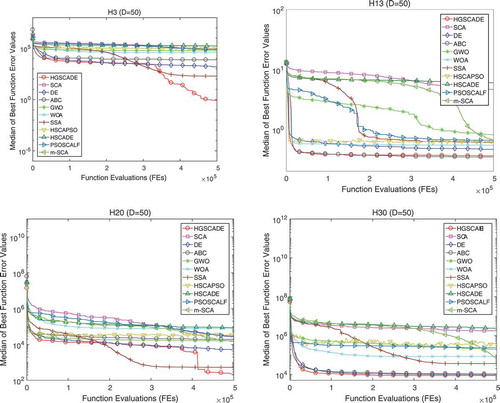
Figure 3. Schematic of cylindricity error
Table 5. Mean and standard deviation of 51 independent runs for all algorithms on the CEC2014 functions with D = 30
Figure 4. The convergence curves of all algorithms for cylindricity error evaluation