Figures & data
Figure 1. Body axis coordinate system
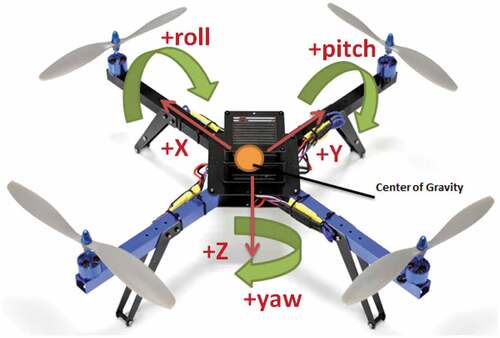
Figure 2. Quadrotor
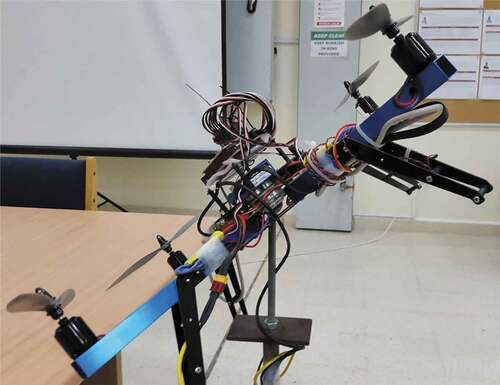
Figure 3. Spherical joint
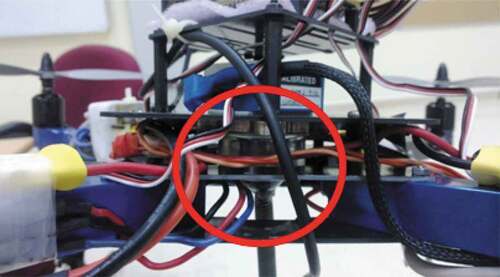
Figure 4. Inputs/outputs diagram
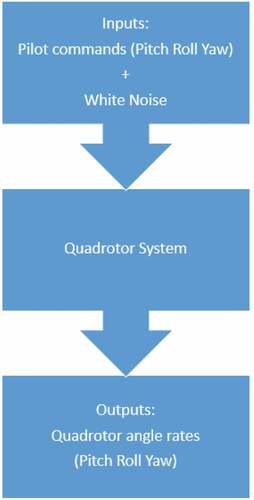
Figure 5. Axis damping feedback loop
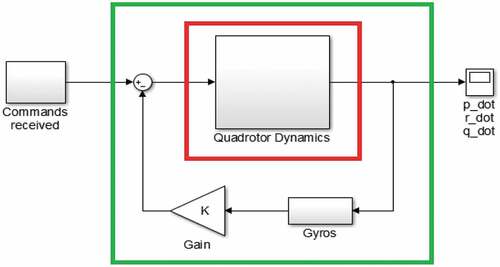
Figure 6. Pin diagram
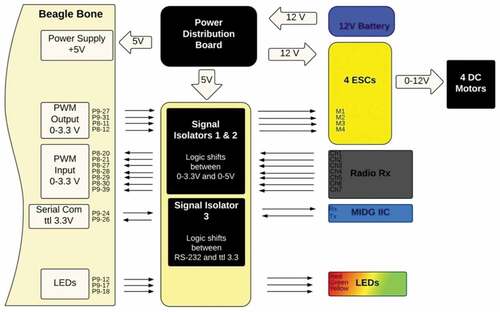
Figure 7. Part of AM335x family memory map (AM335x ARM cortex – A8 microprocessors (MPUs) technical reference manual 2013, 176)
Figure 8. NARX series-parallel architecture (MATLAB Citation2013a. 2013. MathWorks)
Figure 9. NARX parallel architecture (MATLAB Citation2013a. 2013. MathWorks)
Figure 10. Modeling performance of pitch rate transfer function
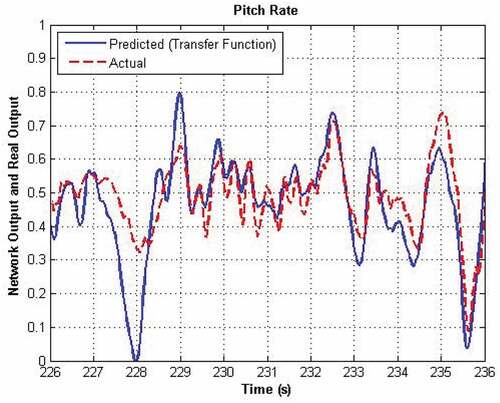
Figure 11. Modeling performance of roll rate transfer function
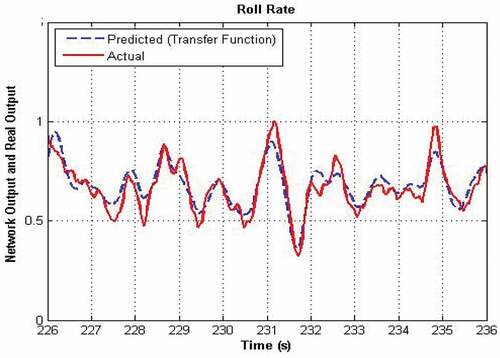
Figure 12. Modeling performance of yaw rate transfer function
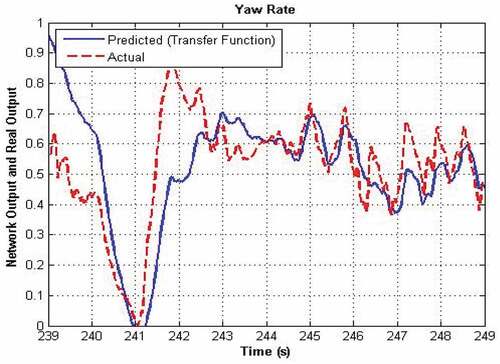
Table 1. CTTF results
Table 2. NARX results
Figure 13. Modeling performance of the NARX model of pitch rate during testing
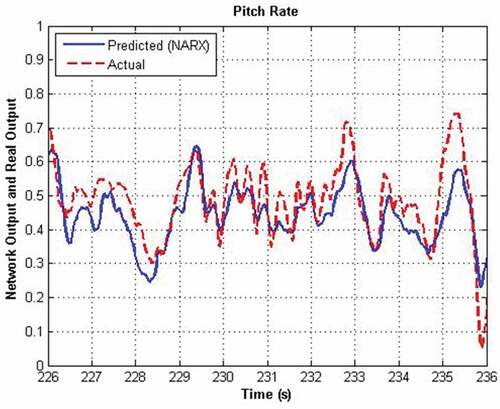
Figure 14. Modeling performance of the NARX model of roll rate during testing
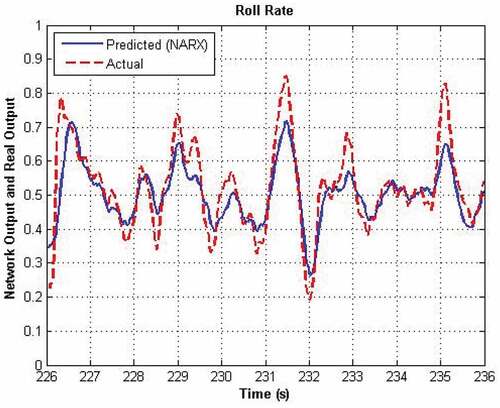
Figure 15. Modeling performance of the NARX model of yaw rate during testing
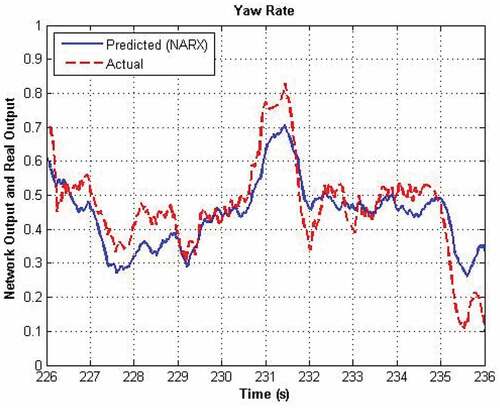
Table 3. NARX results
Table 4. NARX MSE
Figure 16. Number of delays vs MSE for pitch rate
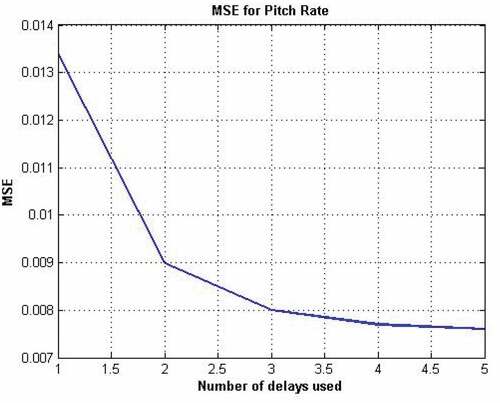
Figure 17. Number of delays vs MSE for roll rate
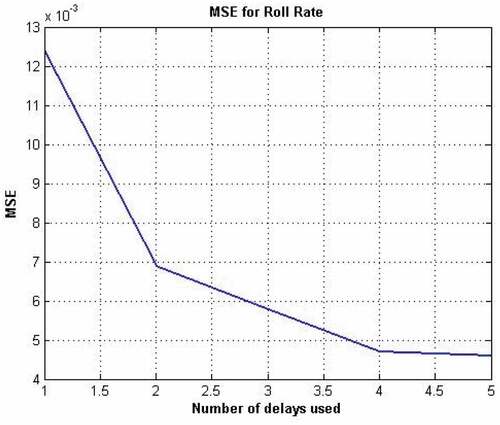
Figure 18. Number of delays vs MSE for yaw rate
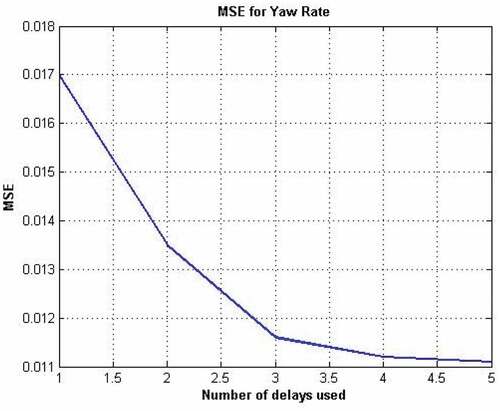
Figure 19. MSE for yaw rate vs training set size
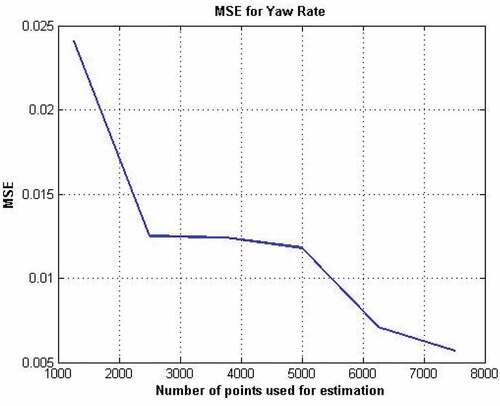
Figure 20. MSE for roll rate vs training set size
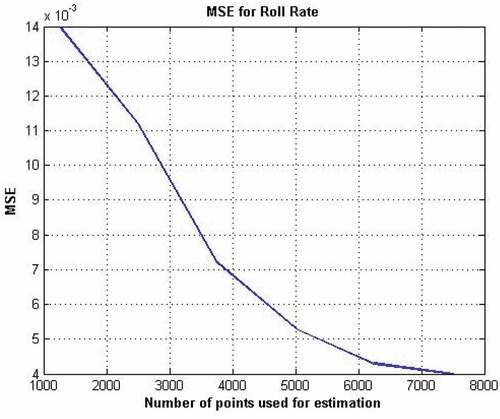
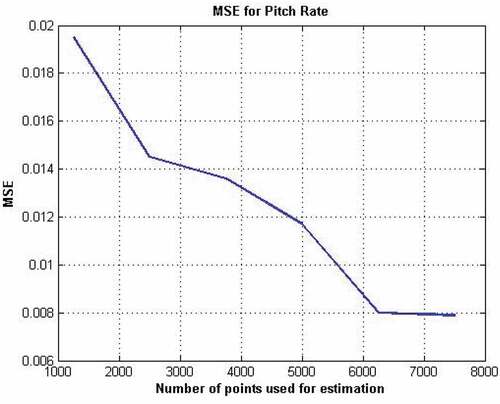
Figure 21. MSE for pitch rate vs training set size